Let's learn about Data Analysis via these 253 free stories. They are ordered by most time reading created on HackerNoon. Visit the /Learn Repo to find the most read stories about any technology.
"Data is a precious thing and will last longer than the systems themselves" ~ Tim Berners Lee
1. The Operational Analytics Loop: From Raw Data to Models to Apps, and Back Again
 Over the next decade or so, we’ll see an incredible transformation in how companies collect, process, transform and use data. Though it’s tired to trot out Marc Andreessen’s “software will eat the world” quote, I have always believed in the corollary: “Software practices will eat the business.” This is starting with data practices.
2. How to Build a Data-Driven Product Using Metabase
 Metabase is a business intelligence tool that lets you access your data in a read-only manner.
3. Creating a Python Discord Bot - How to Get Data for Analysis
 From this article you’ll learn how tо
create Discord bot and add it to the Server;
get the full list of channels from the server;
get a snapshot of Discord memb
4. 6 Biggest Differences Between Airbyte And Singer
 We’ve been asked if Airbyte was being built on top of Singer. Even though we loved the initial mission they had, that won’t be the case. Aibyte's data protocol will be compatible with Singer’s, so that you can easily integrate and use Singer’s taps, but our protocol will differ in many ways from theirs.
5. When Will We See Bitcoin's Top?
 based upon only two data points (we can also look at 2011’s high, which was 30%), my feeling is price will top out when this statistic is near 47-48%
6. 3 Types of Anomalies in Anomaly Detection
 An Introduction to Anomaly Detection and Its Importance in Machine Learning
7. Future of Marketing: How Data Science Predicts Consumer Behavior
 Gradually, as the post-pandemic phase arrived, one thing that helped marketers predict their consumer behavior was Data Science.
8. Why Python Is Leading the Charge in Data Analytics

9. What is Ad hoc Analysis and Reporting, and Why Should you be Careful with it?
 This article originally appeared on the 3AG blog.
10. Crypto Use Explodes, Data Will Help Investors Make Better Decisions
 Investors need good data to make good decisions, and new AI platforms will provide deeper analysis
11. Why Big Data is Big Business: The Netflix Example
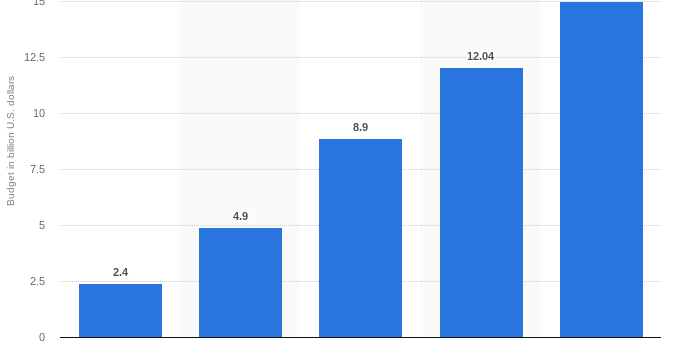 Take a look at the following chart:
12. Equivalence Class Partitioning And Boundary Value Analysis in Black Box Testing
 1. What is black box testing
13. What are the Best Data Analytics Tools?
 Data analytics is used for transforming raw data into useful insights.
14. How To Turn Data Into Actionable Insights For Business Growth
 In this guide, I'll share the most efficient techniques and tools to turn data into actionable insights that you can use to grow your business.
15. Metrics, logs, and lineage: 3 Key Elements of Data Observability
 Data observability is built on three core blocks: metrics, logs, and lineage. What are they, and what do they mean for your data quality program?
16. How to Clean and Verify Address Data 'Without Using Code'
 Today, data verification has become one of the greatest assets of an organization.
17. Using User Data After Google's Third-party Cookies Ban
 Google announced that it would ban the usage of third-party cookies; it has made a lot of publishers afraid that they won't be able to utilize user data.
18. 14 Best Tableau Datasets for Practicing Data Visualization
 This article focuses on the 14 Best Tableau Datasets for Practicing Data Visualization, which is essential for business analysts and data scientists.
19. My Favorite Free Excel Courses for Programmers, Data Analysts, and IT Professionals
 If you want to learn Microsoft Excel, a productivity tool for IT professionals, and looking for free online courses, then you have come to the right place.
20. Automate Submissions for the Numerai Tournament Using Azure Functions and Python
 Python Automation with Azure Functions, to compete in the weekly Numerai tournament.
21. How to Improve Social Media Campaign Using Data Visualization
 Learn what social media data visualization is and why it is important.
22. Pornhub Growth Hack During Coronavirus Pandemic
 The 2019–20 coronavirus pandemic is an ongoing pandemic of coronavirus disease 2019 (COVID-19), caused by severe acute respiratory syndrome coronavirus 2 (SARS-CoV-2). The outbreak was first identified in Wuhan, Hubei, China, in December 2019, and was recognized as a pandemic by the World Health Organization (WHO) on 11 March 2020.
23. What Can You Do When a MAP Violation Occurs?
 Here are some things that you can do when a MAP violation occurs when you least expect it.
24. Lets Study the Seattle Airbnb Data

25. WTF is Automatic Speech Recognition?

26. Decoding MySQL EXPLAIN Query Results for Better Performance
 Understanding MySQL explains query output is essential to optimize the query. EXPLAIN is good tool to analyze your query.
27. Why Use Pandas? An Introductory Guide for Beginners
 Pandas is a powerful and popular library for working with data in Python. It provides tools for handling and manipulating large and complex datasets.
28. An Internal Email to Tim Cook and the State of Business Intelligence
 We get a glimpse into the inner workings of a valuable company and it turns out it's not all sunshine and rainbows.
29. Why Professions Are Adding Analytics to Their Skillsets
 There are many different forms of data analytics, and these have different applications in business.
30. Top 3 Things You Forget When Building Your SaaS Product
 While the number of product management roles in the US has grown by more than 30% in two years, according to LinkedIn, the responsibilities of the job are morphing.
31. 4 Tips To Become A Successful Entry-Level Data Analyst
 Companies across every industry rely on big data to make strategic decisions about their business, which is why data analyst roles are constantly in demand.
32. The Failed Promises of Extract, Transform, and Load—and What Comes Next
 Faster, Better Insights: Why Networked Data Platforms Matter for Telecommunications Companies
33. 10 Best Datasets for Time Series Analysis
 In order to understand how a certain metric varies over time and to predict future values, we will look at the 10 Best Datasets for Time Series Analysis.
34. The Simplest Way to do Exploratory Data Analysis(EDA) using Python Code
 EDA for Data Analysis or Data Visualization is very important. It gives a brief summary and main characteristics of data. According to a survey, Data Scientist uses their most of time to perform EDA tasks.
35. Adopt the Automation Route to Scale Up Your Business
 Machine Learning is advancing steadily, enabling computers to understand natural language patterns and think somewhat like humans.
The advances in Artificial Intelligence (AI) are increasing the prospects of businesses to automate tasks. With automation, you can save time and bring in more productivity for your business.
36. Data Engineering Hack: Using CDPs for Simplified Data Collection
 From simplifying data collection to enabling data-driven feature development, Customer Data Platforms (CDPs) have far-reaching value for engineers.
37. How PostgreSQL Aggregation Inspired Timescale Hyperfunctions’ Design
 Get a primer on PostgreSQL aggregation, how PostgreSQL´s implementation inspired us as we built TimescaleDB hyperfunctions and what it means for developers.
38. 6 Data Analytics Growth Hacks for SMBs
 Data analytics offers you amazing capabilities to grow your business. Leverage the power of these amazing data analytics hacks to reach your business goals.
39. Advantages and Disadvantages of Big Data
 Big data may seem like any other buzzword in business, but it’s important to understand how big data benefits a company and how it’s limited.
40. Introduction to a Career in Data Engineering
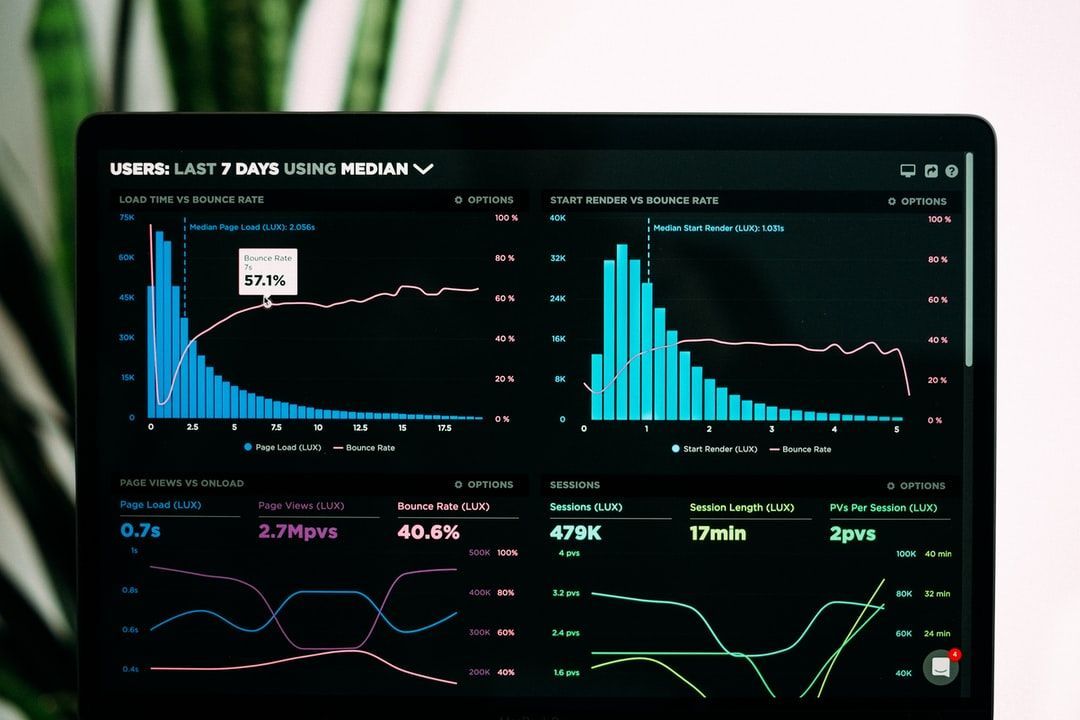 A valuable asset for anyone looking to break into the Data Engineering field is understanding the different types of data and the Data Pipeline.
41. 7 Data Analysis Steps You Should Know
 To analyze data adequately requires practical knowledge of the different forms of data analysis.
42. Top 40+ Data Science Product Interview Questions
 Find the top 40+ product interview questions you must prepare for your next data science interview.
43. Principles of a Clean Relational Database
 The article describes how a relational database should be designed to properly work in OLTP mode.
44. Ethereum Merge: “15 Days Before and After” Data Analysis, Сensorship in Ethereum Blockchain
 In this article, I will analyze what actually happened, taking as a basis 15 days before and 15 days after the transition.
45. Easiest Way to Analyze Vesting Schedule
 What Is Vesting Schedule?
46. Tableau Vs. Power BI: The Complete Comparison
 The world of analytics is continually evolving, introducing new goods and adjustments to the modern market. New companies are entering the market and well-know
47. Analyzing Data From U.S. Road Accidents With Data Visualization
 In this article, we would be analyzing data related to US road accidents, which can be utilized to study accident-prone locations and influential factors.
48. Conversational AI is Changing the Way We Interact With Data
 Large language models like ChatGPT are making it easier to manage data. Akkio has come up with an LLM-based tool to manage tabular data using conversational AI.
49. Behavioral Data Collection: How Gaming Might Help Study ADHD
 With the development of more games specifically designed for this purpose, we expect to see a significant increase in the use of gaming as a tool...
50. Clean Up Your Data by Removing Duplicate Data Using these Tools
 In this blog, we will look at what a data deduplication software is, the most crucial features and functionalities found in such a tool, and how it can help you
51. If Growth Marketing Is So Terrible, Why Don't Statistics Show It?
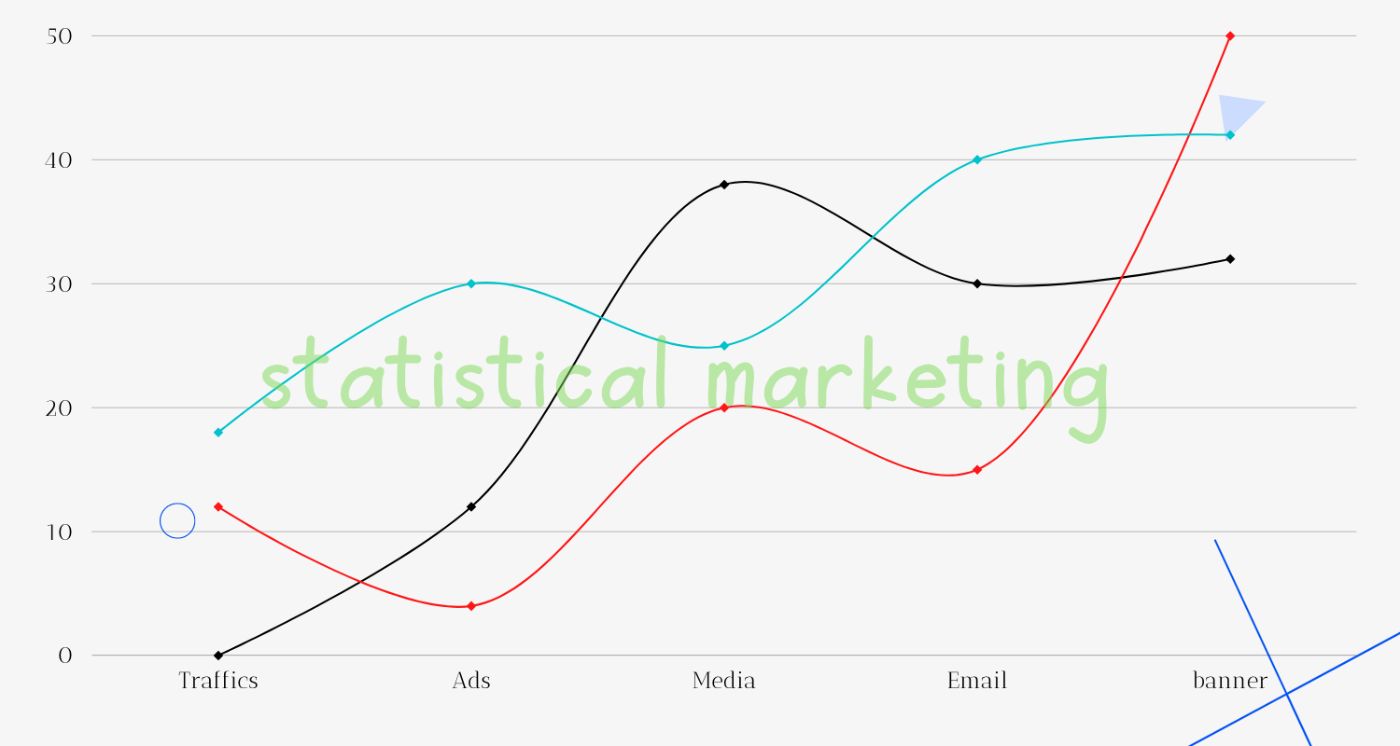 Growth marketing is a data-driven approach that focuses on acquiring, retaining, and growing a customer base, though there are those who argue that it is flawed
52. Decoding MySQL EXPLAIN Query Results for Better Performance (Part 2)
 Understanding MySQL explains query output is essential to optimize the query. EXPLAIN is good tool to analyze your query.
53. Watch Out for Deceitful Data
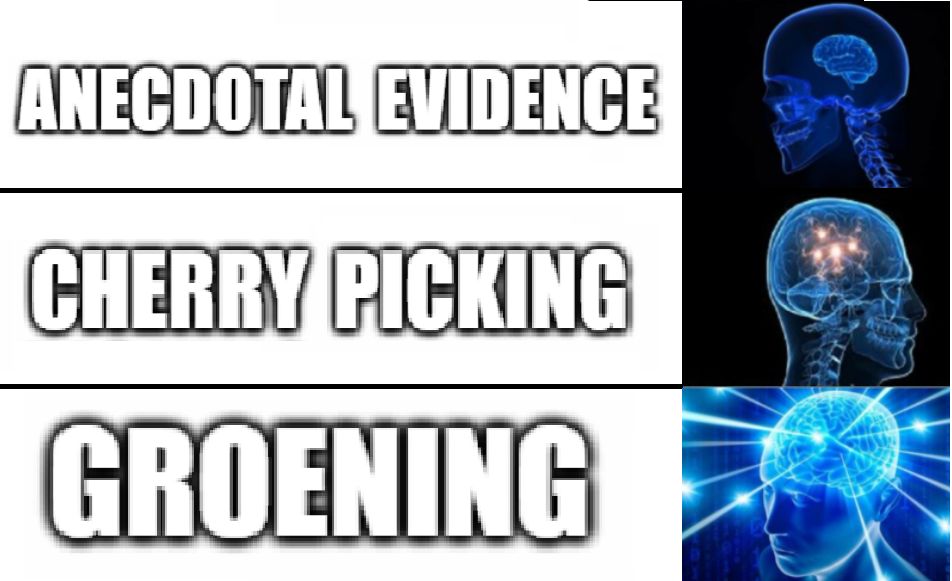 Nowadays, most assertions need to be backed with data, as such, it is not uncommon to encounter data that has been manipulated in some way to validate a story.
54. Comprehensive Data Analysis with SQL and Data Visualization: Alibaba User’s Behavior Investigation
 This user behavior report is based on users’ orders from Alibaba between November 25th, 2017, and December 3rd, 2017 from the Alibaba platform...
55. How to Use Public Web Data for Talent Intelligence and Sourcing
 Learn how public web data can boost your talent sourcing efforts in both quality and quantity.
56. Why You Need a Flawless Post Merger Integration Strategy
 Over 80 percent of mergers fail due to poor planning and delays. Some of the biggest causes behind poor planning are a lack of strategy, unclear vision, inept mindset, invasive culture, and most importantly lack of data understanding.
57. 4 Ways Data Quality Can Add Value To Your Retail Business
 Convert leads into customers and boost your customer outreach by analyzing high-quality real-time data captured from data silos.
58. How to Use Tableau Visualization to Make a Covid Risk Model
 In this paper, I used data from two different data sources and merged them together in the Tableau layer to perform the data analysis.
59. 4 Data Transformations Made Spreadsheet-Easy
 Gigasheet combines the ease of a spreadsheet, the power of a database, and the scale of the cloud.
60. Fırat Civaner Became Sad About People Who Lost Their Jobs, Health And Lives
 Fırat Civaner from Turkey has been nominated for a 2020#Noonie in the Future Heroes and Technology categories..
61. 13 Best Datasets for Power BI Practice
 In 2022, Gartner named Microsoft Power BI the Business Intelligence and Analytics Platforms leader. These are the 13 Best Datasets for Power BI Practice.
62. 5 Most Important Tips Every Data Analyst Should Know
 The 5 things every data analyst should know and why it is not Python, nor SQL
63. A Quick Guide To Business Data Analytics
 For many businesses the lack of data isn’t an issue. Actually, it’s the contrary, there’s usually too much data accessible to make an obvious decision. With that much data to sort, you need additional information from your data.
64. What Are the Key Differences Between Qualitative and Quantitative Data?
 This article uncovers the key differences between qualitative and quantitative data with examples.
65. Understanding the Differences between Data Science and Data Engineering
 A brief description of the difference between Data Science and Data Engineering.
66. Spotify Audio Features Time Series in Additive Spotify Analyzer
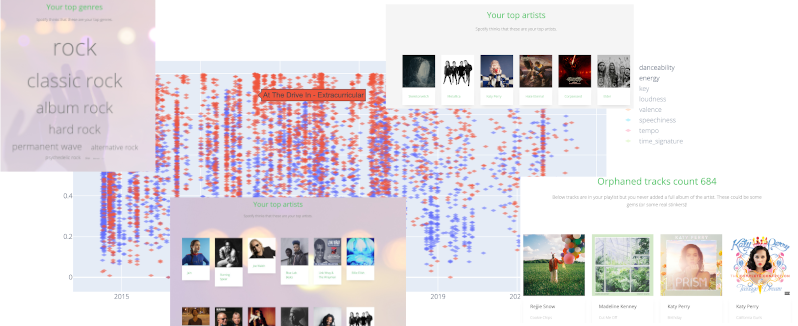 There are many articles on analyzing Spotify data and many applications as well. Some are a one-time analysis on individual's music library and some are an app for a specific purpose. This app is different in that it does not do one thing. It is meant to grow and provide a place to add more analysis. This article is about how the audio features time series was created.
67. Noonies Interview: Luke Calton On Product Management and Writing
 Luke Calton is Noonies Nominee and a Product Manager at a start-up.
68. Estimating Price Elasticity with Machine Learning
 Using machine learning, multi-linear regression, and scikit-learn to estimate price elasticity for wine products.
69. Solving Noom's Data Analyst Interview Questions
 Noom helps you lose weight. We help you get a job at Noom. In today’s article, we’ll show you one of Noom’s hard SQL interview questions.
70. How Pandemic Testing Protocols Vary Across The USA

71. Creating a Dependable Data Pipeline for Your Small Business
 In this article, I will be showing you how to build a reliable data pipeline for your small business to improve your productivity and data security.
72. 7 Types of Data Bias in Machine Learning
 Data bias in machine learning is a type of error in which certain elements of a dataset are more heavily weighted and/or represented than others. A biased dataset does not accurately represent a model’s use case, resulting in skewed outcomes, low accuracy levels, and analytical errors.
73. Displacement of Low-Income Minorities in San Francisco
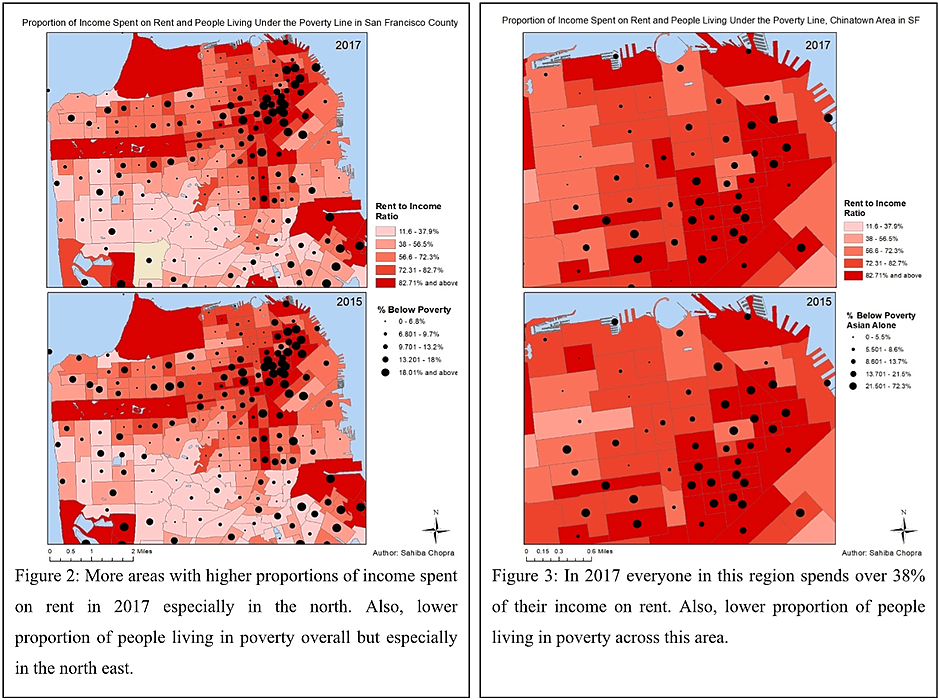 San Francisco’s housing crisis perpetuates the poverty trap faced by low income minorities in the city.
74. Understanding the Main Differences between Structured and Unstructured Data
 In this, I explore structured, unstructured, and semi-structured data, as well as how to convert unstructured data, and AI’s impact on data management.
75. How To Blend Data in Google Data Studio For Better Data Analysis
 Google Data Studio helps us understand the meaning behind data, enabling us to build beautiful visualizations and dashboards that transform data into stories.
76. Fintech 2021: How Fintech Companies Use Big Data Effectively?
 According to a study, 90% of the whole world’s data was created in the last two years. This sounds quite cool but what does the world do with all that data? How does one analyze it?
77. How to Think Like a Data Scientist or Data Analyst

78. How to Create A Funnel Chart In R
 Funnel Chart in R, A funnel chart is mainly used for demonstrates the flow of users through a business or sales process.
79. Automated Machine Learning for Data Analysts & Business Users
 Automated Machine Learning (AutoML) represents a fundamental shift in the way organizations of all sizes approach machine learning & data science.
80. 5 Most Common Data Quality Issues For Business
 With the advent of data socialization and data democratization, many organizations organize, share and make information available to all employees in an efficient manner. While most organizations benefit from liberal use of such a source of information available to their employees, others struggle with the quality of the data they use.
81. 10 Best React Native Chart Libraries
 Representing statistical data in plain text or paragraphs, tables are pretty boring in my opinion. What about you?
82. Behavioral Analytics: The Foundation of Targeted Marketing and Predictive Analytics
 Learn how to capitalize on your business standards and increase the conversion rate by approximately 85% by analyzing customer behaviors with data you collect.
83. Self-service Data Preparation Tools Can Optimize Big Data Efficiency for the IT Team
 Self-service data preparation tools are designed for business users to process data without relying on IT, but that doesn’t mean IT users can't benefit too.
84. Statistics Cheat Sheet: A Beginner's Guide to Probability and Random Events
 A beginner’s guide to Probability and Random Events. Understand the key statistics concepts and areas to focus on to ace your next data science interview.
85. Opportunities And Challenges of Integrating Power Business Intelligence

86. 5 Things to Watch Out for When Implementing Tableau BI

87. Our Data-Driven Approach to Making Sense of the 2020 Presidential Election
 In less than five months, the world’s attention will be drawn to the outcome of the US Presidential election.
88. How AI and Data Analytics Will Impact The Era of COVID-19
 Artificial intelligence (AI) and data analytics are rapidly growing trends in the tech world. With increasing potential for innovation, it is paramount that we stay up to date with all the latest developments in this field. According to MarketsandMarkets, the worldwide artificial intelligence (AI) market will increase from USD 58.3 billion in 2021 to USD 309.6 billion by 2026, at a compound annual growth rate (CAGR) of 39.7 percent over the projected period. It seems that every company wants a piece of this growing pie. By 2022 it is expected that 90% of companies will be using some form of artificial intelligence for data analytics purposes.
89. Assessing Your Organization's Customer Data Maturity
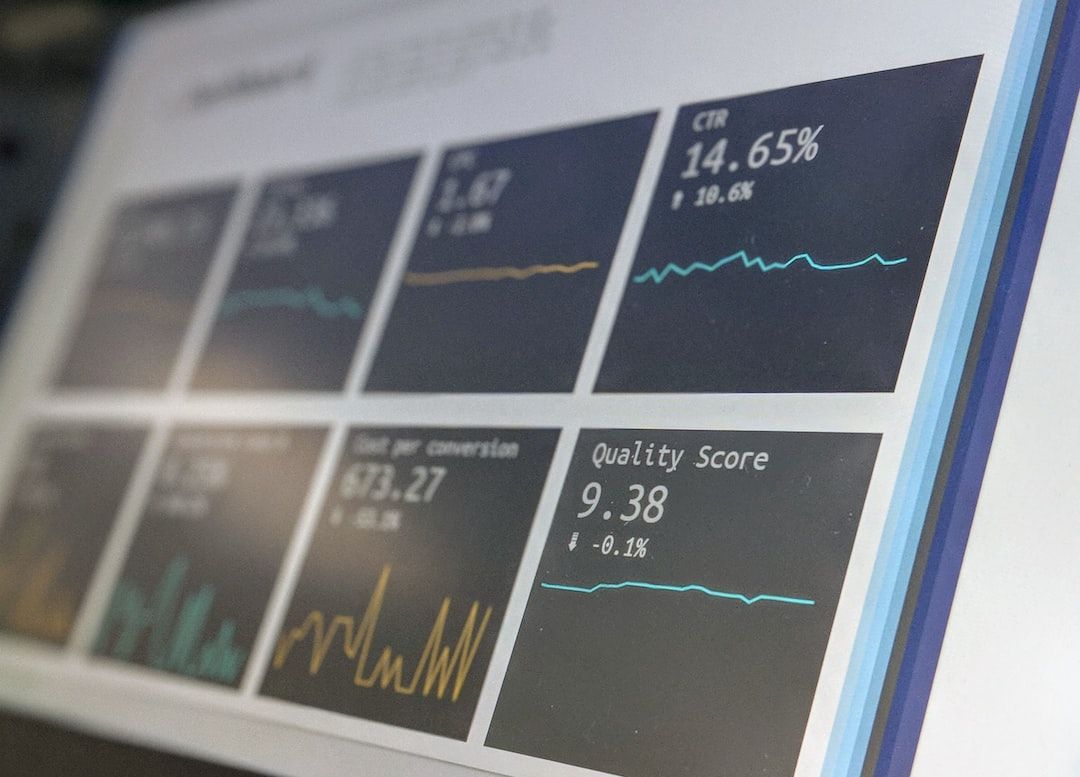 Investing in customer data is a top priority for marketing leaders.
90. Public Web Data for Business: Common Challenges And How to Solve Them
 Businesses working with public web data experience various challenges. This article covers the most common ones and how to overcome them.
91. An Essential Plan to Get Your SQL Knowledge Ready for Interviews
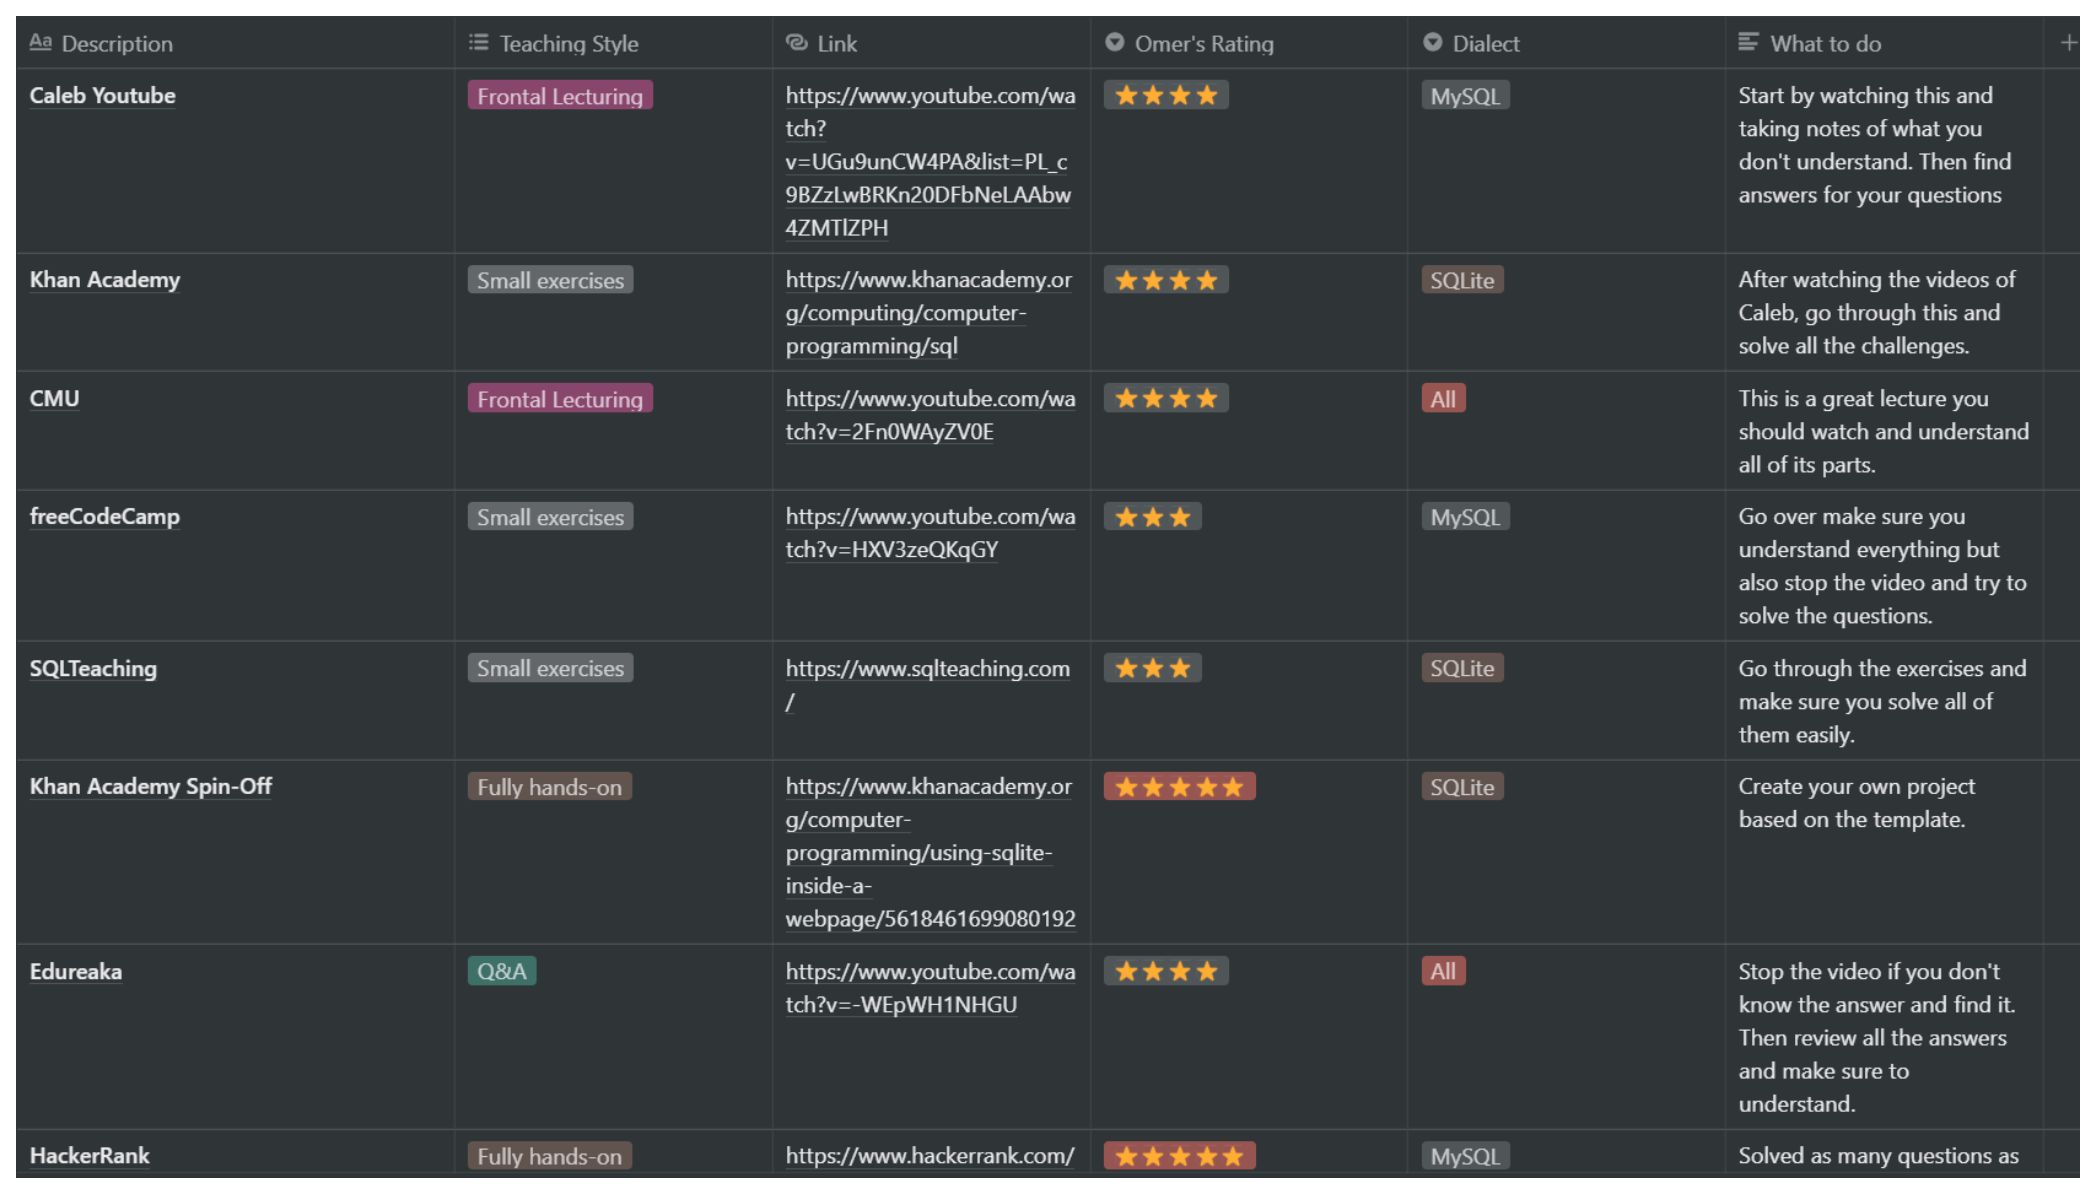 SQL is the cornerstone of a wide variety of data-intensive roles, and it is not going anywhere soon. Loads have been written about its usefulness already, so this post is focused on getting your skills from C to A+ for your interviews. No knowledge is assumed, and I feel comfortable promising that your level will be more than enough for what will be asked in interviews if you follow this game-plan.
92. How The Heck Did Robinhood Become So Popular? A Data Driven Analysis
 Robinhood launched over seven years ago as a stock prediction app, before it became the brokerage we have today.
93. Can Your Organization's Data Ever Really Be Self-Service?
 Self-serve systems are a big priority for data leaders, but what exactly does it mean? And is it more trouble than it's worth?
94. Can AI and Computer Vision Replace Human Intuition?
 Computer vision now lives with us with exceptional AI capabilities. Learn how AI and computer vision is playing a key role in outsmarting human beings.
95. Top 6 Data Visualization Tools for 2022
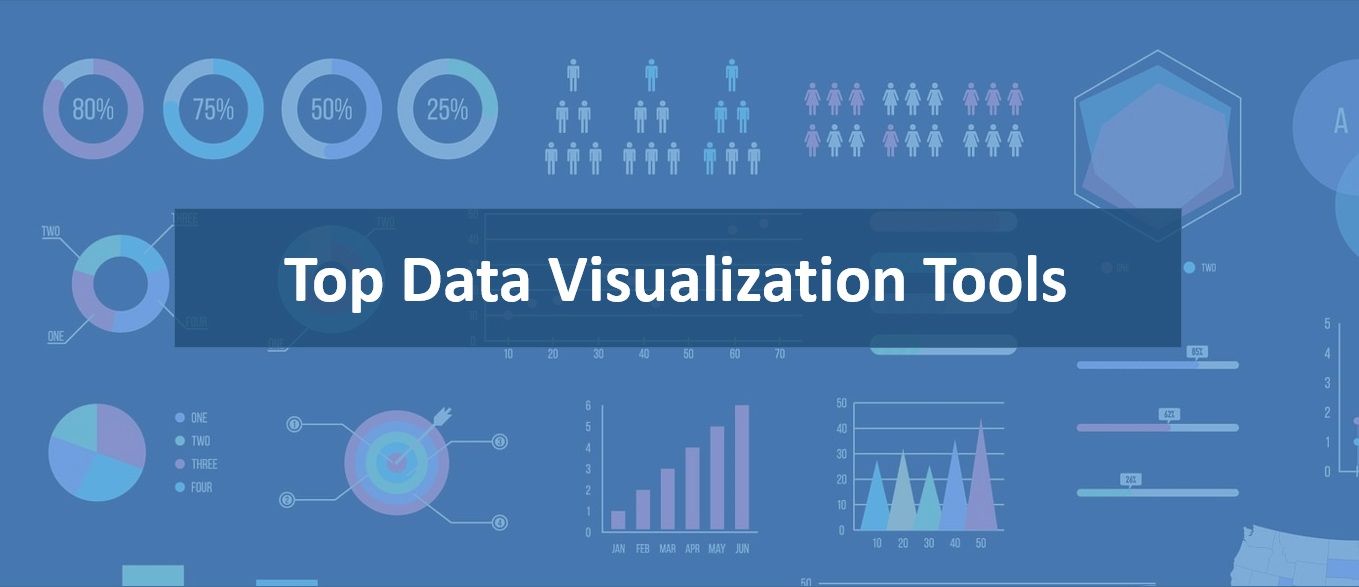 In this blog you will discover best data visualization tools to effectively analyze your datasets. Learn about the tools to create intuitive visualization.
96. 3 Data Distributions for Counts in Layman’s Terms
 Counts are everywhere, so no matter your background, these data distributions will come in handy.
97. Top Data Analyst Skills in 2021
 Enhance your knowledge and skills in the field of data analytics with the help of data science certification for a rewarding career as a data analyst.
98. How Different Industries Put Data Analytics to Use
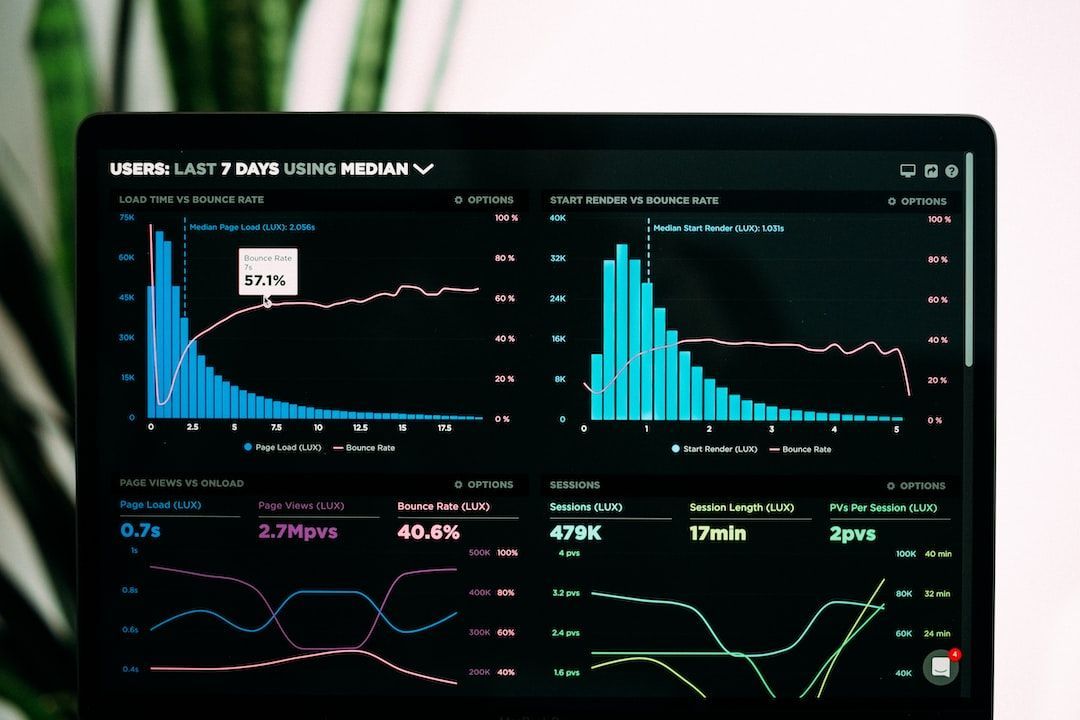 You must have heard about big data and the theory used behind it. However, are you aware of the top industries where data analytics is being used for changing the way we work in the actual world? Let's take a close look at the top big data industries and how they are getting reshaped by using data analytics. The main idea behind using big data is that it is a new method for gaining insight into the challenges faced by various companies each day. In earlier days it was not possible to collect and interpret a vast quantity of data because there was no technology available.
99. Using Data Science to Predict Effects of New UK Fishing Zonal Attachment Proposal
 The UK government is pushing for a “zonal attachment” model, where quotas would be carved up relative to the abundance of fish in each country’s waters.
100. How To Create Customer Segmentation using Google Analytics and A Spreadsheet
 Using Google Analytics, we can analyze our customer behaviors based on their interests, commonly features through clicks, time on page, bounce rate, custom events, etc. and their behaviors as shoppers, such as add to basket, average product quantity basket, LTV, AOV, etc.
101. 21 Best Coursera Courses and Certificates for IT Professionals to Learn Data Science and Cloud
 Here are the top 20 Coursera Courses and Certifications to Learn Data Science, Cloud Computing, and Python.
102. Bitcoin’s Price Peak Is Coming This Month - Stock-to-Flow Says . . .
 Stock-to-Flow predicts bitcoin's price will stay above $100,000 from summer to the end of this year. What if that doesn't happen?
103. How Data Analysis Helps Unveil the Truth of Coronavirus
 These days we are all scared of the new airborne contagious coronavirus (2019-nCoV). Even if it is a tiny cough or low fever, it might underlie a lethargic symptom. However, what is the real truth?
104. Customer Analytics Tools for Every Business Size
 Customer analytics tools could be boon for businesses. They provide increase sales opportunities and better customer predictions which enable better decisions.
105. How To Invest More Intelligently
 A decade and half ago, when I first started getting interested in public markets investing, I had started by making a small portfolio that I could play with. Just to see if I actually knew what I thought I knew, and to try and make sense of my beliefs about the market. And no surprise, I didn't know what I thought I knew.
106. 5 Steps to Build a Data-Driven Product Development Culture
 Early stages of product development are one of the most exciting times to be a part of the company as a product manager. One of the most important factors that drive the growth and success of the product is how quickly it acquires a large and loyal base of customers. You want these customers to use your product as frequently as possible with minimum friction.
107. Power BI and Fintech: A Match Made In Heaven To Optimise Banking Operations
 Technology keeps evolving, and the incorporation of technology helps businesses of varying types to make profits and meet customer needs better.
108. An Introduction to Data Automation for Business Efficiency
 In today’s competitive business landscape, data automation has become necessary for business sustainability. Despite the necessity, it also comes with a few challenges--collecting, cleaning, andputting it together--to get meaningful insights.
109. A New Netflix Style Reality Show for People Who Love Data
 Seven data professionals gear up to analyze and visualize one of the largest and robust datasets out there to win the title - The Iron Analyst!
110. Artificial Intelligence: The Future Of Travel Industry
 Machines may not have taken over the world yet, but they are seeping into our lives and making it better. AI is changing every aspect of our lives. From self-driving cars to talking bots, there are so many examples of AI in use today. The technology is disrupting so many industries, and the travel industry isn’t exempt from this. Gone are the days when you had to count on a travel agent to plan your next vacation. You no longer need to engage yourself in that tiresome chain of conversations with your agent for your travel arrangements. AI now infiltrates every aspect of the travel industry. With the help of this technology, you can get personalized and intelligent travel solution tailored according to your needs.
111. 6 Tips for Working With Analysts and Data Engineers
 What work does a data engineer actually do? Let me tell you one thing: it’s not what you think they should be doing, especially not the part where they are running around collecting data for you or building yet another one of those dashboards that will only be used for a few weeks.
112. Creating an Interactive Word Tree Chart with JavaScript
 Learn how to create beautiful interactive JavaScript Word Trees and check out an awesome Word Tree chart visualizing the text of The Little Prince.
113. 3 Best Ways To Import External Data Into Google Sheets [Automatically]

114. 20 Herramientas de Inteligencia Empresarial (BI) más Populares en 2020
 Business Intelligence (BI) es un negocio basado en datos, un proceso de toma de decisiones basado en datos recopilados. A menudo es utilizado por gerentes y ejecutivos para generar ideas procesables. Como resultado, BI siempre se conoce indistintamente como "Business Analytics" o "Data Analytics".
115. Why Python is Best Programming Language for Data Science & Machine Learning?
 If you want to become a Data Scientist and are curious about which programming language should you learn then you have come to the right place.
116. Why Sales Teams Love Business-Oriented Chatbots
 The average wait time on a live chat is roughly 35 seconds, and with every growing second you have an unanswered chat, you're likely to lose a lead.
117. How Smart Analytics Can Help Small Businesses Boost Sales
 Technology has taken over the world, now is the time for small businesses to realize that what they need is tech. Smart analytics makes everything easier.
118. Oracles on StarkNet
 Comments on level of decentralization for oracles currently available for the Defi ecosystem of StarkNet. Detailed data analysis was done of the data.
119. Data Science From Scratch

120. Learn How To Group Data in SQL Using The GROUP BY Clause [Tutorial]
 Learn how to group data in SQL using the GROUP BY clause. In this article, I’ll show you this process by using a sample of marketing data.
121. Key Aspects of Machine Learning Operations, Explained
 If you have ever worked or currently working in the IT field, then you definitely faced the common term «machine learning.
122. How AI Empower Sustainable Growth of the Organisations
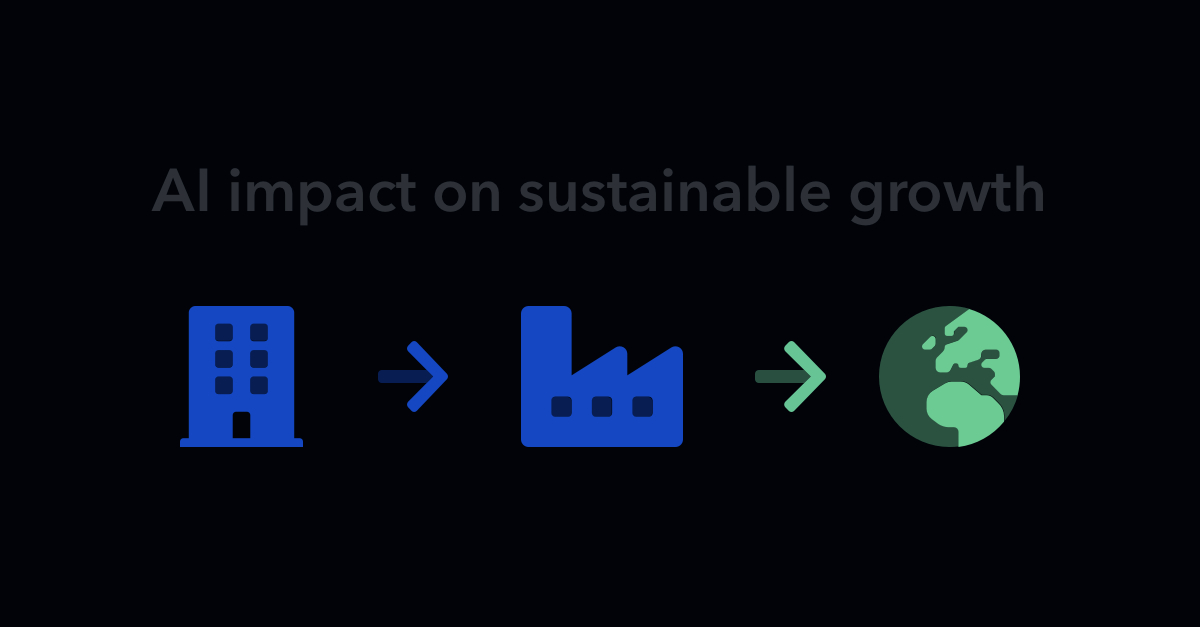 The propagation of artificial intelligence (AI) is making a significant impact on society, changing the way how we work, live, and communicate. AI today is allowing the world to diagnose diseases and develop clinical pathways. It is also being used to match individuals’ skill sets with job openings and create smart traffic that leads to the reduction of pollution. There are many examples of applying AI technologies in the sustainable growth of the planet and organisations.
123. Big Data Analysis for the Clueless and the Curious
 Big data analytics has been a hot topic for quite some time now. But what exactly is it? Find out here.
124. How to Scan Your Systems for Personal Data
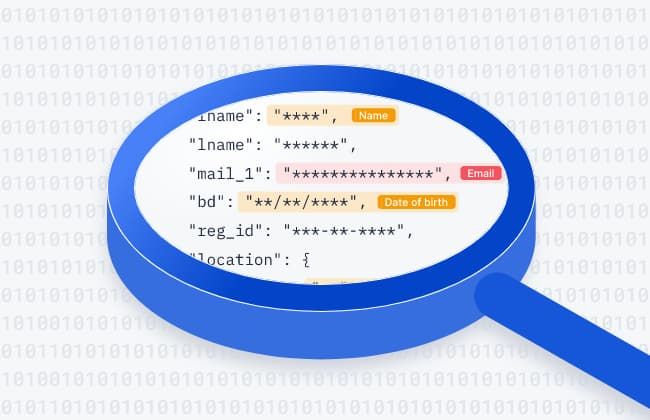 Learn the many different ways you can scan for personal data across your organisation's customer-facing online systems in this practical, how-to guide.
125. COVID-19: "In God We Trust, All Others Must Bring [CLEAN] Data"
 In these difficult days for all of us, I’ve heard all sorts of things. From the fake news sent through Whatsapp, like vitamin C can save your life, to holding your breath in the morning to check if you’ve been hit by COVID-19. The mantra that everyone keeps repeating is “stay at home!”, okay fine, but what exactly does “stay home” mean? The question seems ridiculous when you think of a relatively short period, 15 days? A month? But if we look critically at the situation, we surely realize that it won’t be 15 days, and it won’t be a month. It will be a long, long time. Why am I saying this? Because “stay at home” doesn’t protect us from the virus. Staying at home is to protect our health care facilities from collapse. And I’m not saying that this is wrong. I’m just saying that if we want to protect the health care system from collapse, well then we’ll stay home a long, long time. But in doing so we will irreparably damage the economic system by profoundly changing our social and political model. It is inevitable. Let’s face it and not have too many illusions.
126. Use the 80/20 Rule with Moderation

127. Top 8 Best Qlik Sense Extensions
 Qlik Sense is powerful data visualization and BI software. But sometimes its functions are not enough. Meet the best Qlik Sense extensions to do more with data!
128. Google Shopping Market Analysis of Sports & Outdoors
 The Market analysis of Google Shopping for Sports & Outdoor Category. The insights consists of Top retailers, brands, products and price changes.
129. What is a Citizen Data Scientist and How Do You Become One?
 Data science has been democratized for the most part. AI is now mainstream! It's no longer the exclusive province of large companies with deep pockets.
130. Data Will Never Be Clean But You Can Make it Useful
 Understanding how to clean data is essential to ensure your data tells an accurate story
131. 3 Best Ways To Import JSON To Google Sheets [Ultimate Guide]

132. How To Become A Data Scientist: Skills & Courses To Learn Data Science
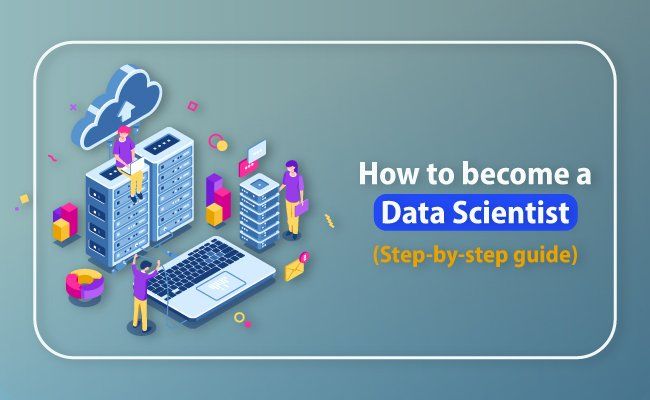 The necessary skills to build a Data Scientist’s profile are business intelligence, statistical knowledge, technical skills, data structure, and more.
133. Small Businesses use AI Tools to Increase Their Leads By 50%
 AI can empower sales reps by monitoring different signals and predicting a specific lead's readiness to purchase. AI tools can reduce customer acquisition costs
134. A Brief Intro to 8 Ways AI Could Improve Patient Care
 How much data does a hospital produce each day? How much information are they capable of storing, analyzing, and sharing with physicians and patients?
135. The Most Commonly Used SQL Queries by Data Scientists
 SQL (Structured Query Language) is a programming tool or language that is widely used by data scientists and other professionals
136. Using Data Analytics Effectively in Marketing
 How to make your data work harder for you in marketing
137. 4 Ways Data Science Helps Streamline Business Operations
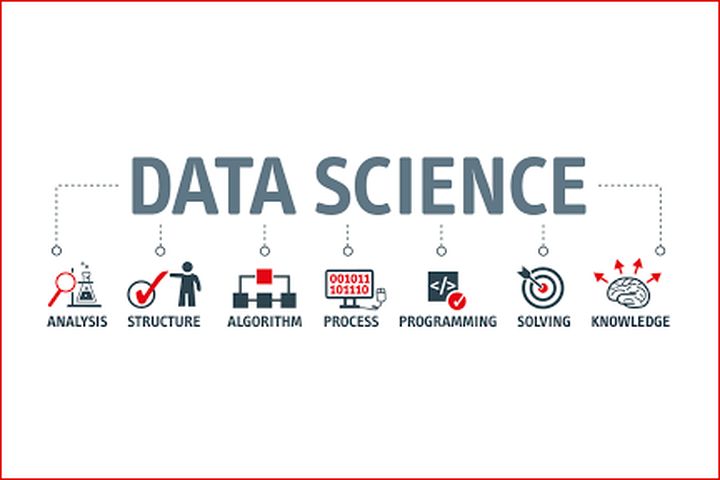 Data Science has changed the way organizations collect, analyze, and process different types of information.
138. How to Generate Sales from Inactive Customers and Boost E-commerce
 What does marketing automation mean? Are activities planned triggered on user-generated events. Simple and clear.
139. Privacy Protection and Web3 Analytics
 Though there have been more and more developers and product designers joining Web3.0 world in recent years, it is almost ignored by most of them that they are still using centralized infrastructure — data analytic tools — to build apps and webs. Every minute, project builders are making themselves part of the reason for data breach events, as they have to collect user data intendedly or unintendedly for product improvement.
140. Kimball & Inmon vs. the Retail Store

141. How To Solve the Problem With Key Metrics In a B2B Product
 To learn how B2B companies solve the problem with key metrics in a product, I caught up with Yuri Brankovsky who has worked in multiple digital products.
142. An Introduction to 4 Types of Audio Classification
 Audio classification is the process of listening to and analyzing audio recordings. Also known as sound classification, this process is at the heart of a variety of modern AI technology including virtual assistants, automatic speech recognition, and text-to-speech applications. You can also find it in predictive maintenance, smart home security systems, and multimedia indexing and retrieval.
143. Using Real-Time Data in Digital Marketing
 Learn how you can use real-time data in digital marketing for customer engagement and retention, analyze real-time data for faster decision-making
144. The New Frontier of Price Optimization
 What would be the price of our product or service? This question has bothered businesses forever. Several pricing models have been spawned as a result. But the concept of price optimization is a fairly new one. At least to businesses that are not in the hospitality or airline sector.
145. Can Big Data Solutions Be More Accessible And Affordable?
 Below you can find the article of my colleague and Big Data expert Boris Trofimov.
146. How to Analyze and Process Unstructured Data in 5 Simple Steps
 In this article, we’ll look at how to analyze and process unstructured data while using business intelligence tools to simplify the entire process.
147. Getting Started with Data Visualization: Building a JavaScript Scatter Plot Module
 Scatter plots are a great way to visualize data. Data is represented as points on a Cartesian plane where the x and y coordinate of each point represents a variable. These charts let you investigate the relationship between two variables, detect outliers in the data set as well as detect trends. They are one of the most commonly used data visualization techniques and are a must have for your data visualization arsenal!
148. Beyond Artificial Intelligence: Providing Insights to Your Customers
 <meta name="monetization" content="$ilp.uphold.com/EXa8i9DQ32qy">
149. 4 Social Media Data Mining Techniques to Help Grow Your Online Business
 Social media data mining has become a must-have strategy for understanding current trends, culture, and online business. This is because the world of social media is a thriving, ever-growing ocean of data, where hundreds of millions of tweets, instagram posts, and blog articles are published every day.
150. The Art of Data Storytelling: How to Make Your Data Impactful

151. Football Data Analysis Using Machine Learning Models Can Potentially Boost Throw-Ins!
 “Can machine learning models help improve ball accuracy, precision and retention, leading to scoring after throw-ins?
152. Best Libraries That Will Assist You In EDA: 2021 Edition
 Exploratory Data Analysis (EDA) is an essential step in the data science project lifecycle. Here are the top 10 python tools for EDA.
153. Retraining Machine Learning Model Approaches
 Retraining Machine Learning Model, Model Drift, Different ways to identify model drift, Performance Degradation
154. Using Data Attribution Comparison Table in Google Analytics 4
 The configuration of Google Analytics 4 is not a walk for those unfamiliar with analytical tools or data setup.
155. Data Quality: Its Definitions And How to Improve It
 Utilizing quality data is essential for business operations. This article explores data quality definitions and how to maintain it for everyday use.
156. Why Self-Service Analytics Tools Are Important For Business Decisions Making
 How to use Big Data, Self-Service Analytics Tools and Artificial Intelligence to Empower your Company Business Decisions Makers with State Of The Art Software
157. How to Create a Bubble Map with JavaScript to Visualize Election Results
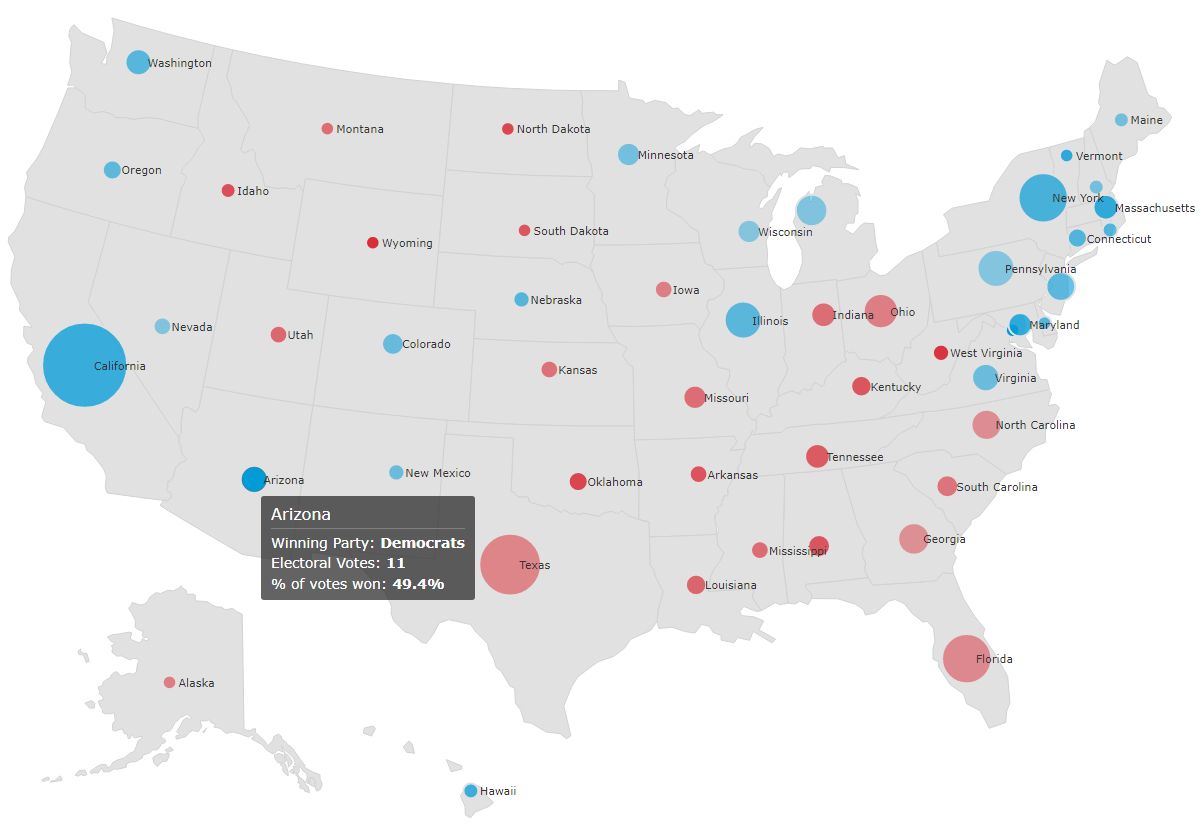 A beginner level tutorial to get started with data visualization by creating an interesting and intuitive JavaScript bubble map
158. What Is Big Data? Understanding The Business Use of Big Data Analytics
 Big data analytics can be applied for all and any business to boost their revenue and conversions and identify their common mistakes.
159. A Hacker Tried to Steal $566M by Exploiting a Code Smell, Here's How
 Yesterday, 2022 Oct 7th one of the larger blockchains had to be halted. This news was shocking since most blockchains are decentralized by definition.
160. I Used Python To Analyze My Peloton Workout Stats With Real-Time Updates
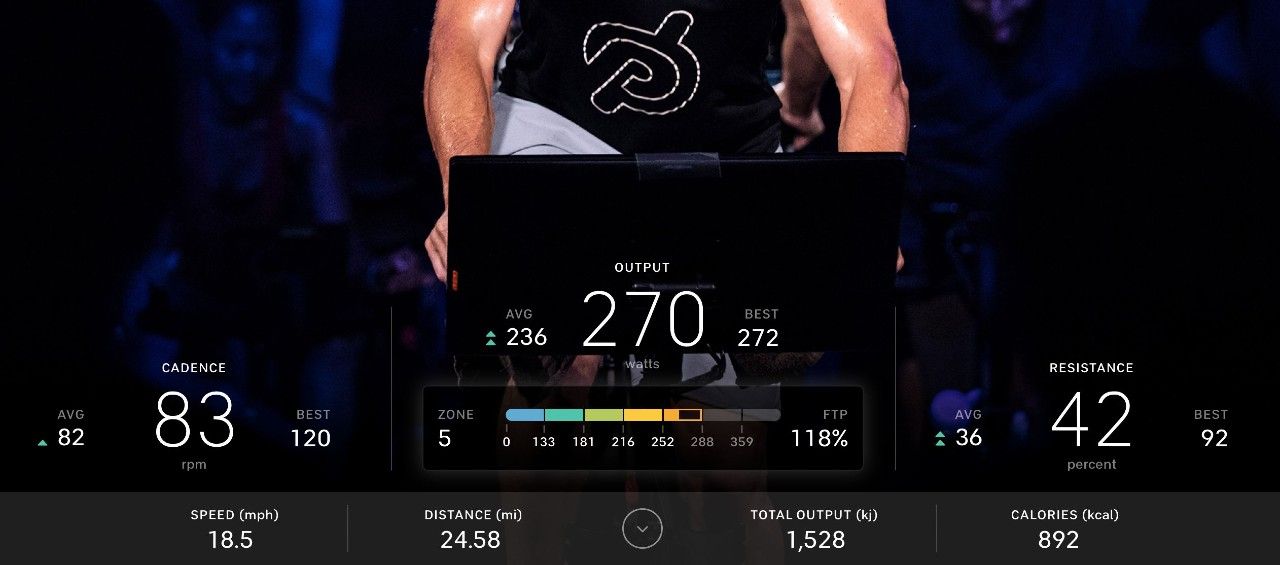 A tutorial on how you can sync and analyze your Peloton workout stats into Coda with custom dashboards. Sync with a Google Apps Script or serverless function on
161. What is the Significance of Time-Weighted Averages in Data Analysis
 Learn how time-weighted averages are calculated, why they’re so powerful for data analysis, and how to use TimescaleDB hyperfunctions to calculate them faster.
162. Dear Marketer: Every Average Lies, You Must Go Deeper
 “It’s a basic truth of the human condition that everybody lies. The only variable is about what…”
“Truth begins in lies…"
163. Are You Poisoning Your Data? Why You Should Be Aware of Data Poisoning
 As machine learning gains more prominence, these attacks may become more common. Here’s a closer look at data poisoning and what companies can do to prevent it.
164. How to Use No-Code Machine Learning to Optimize your HackerNoon Articles
 Learn how to use machine learning to predict the success of articles on Hackernoon before you hit 'publish' and improve your reach and success as a writer
165. How to use Python Seaborn for Exploratory Data Analysis

166. Practical Tips to Improve Customer Experience with Data
 According to a report, almost 70% of companies compete on customer experience.
167. How To Segment Shopify Customer Base with Google Sheets and Google Data Studio
 After defining what the RFM analysis is standing for, and how you can apply it to your Customer Base, I want to show you how to apply it on Shopify orders data.
168. What is RFM (Recency, Frequency, Monetary) Analysis?
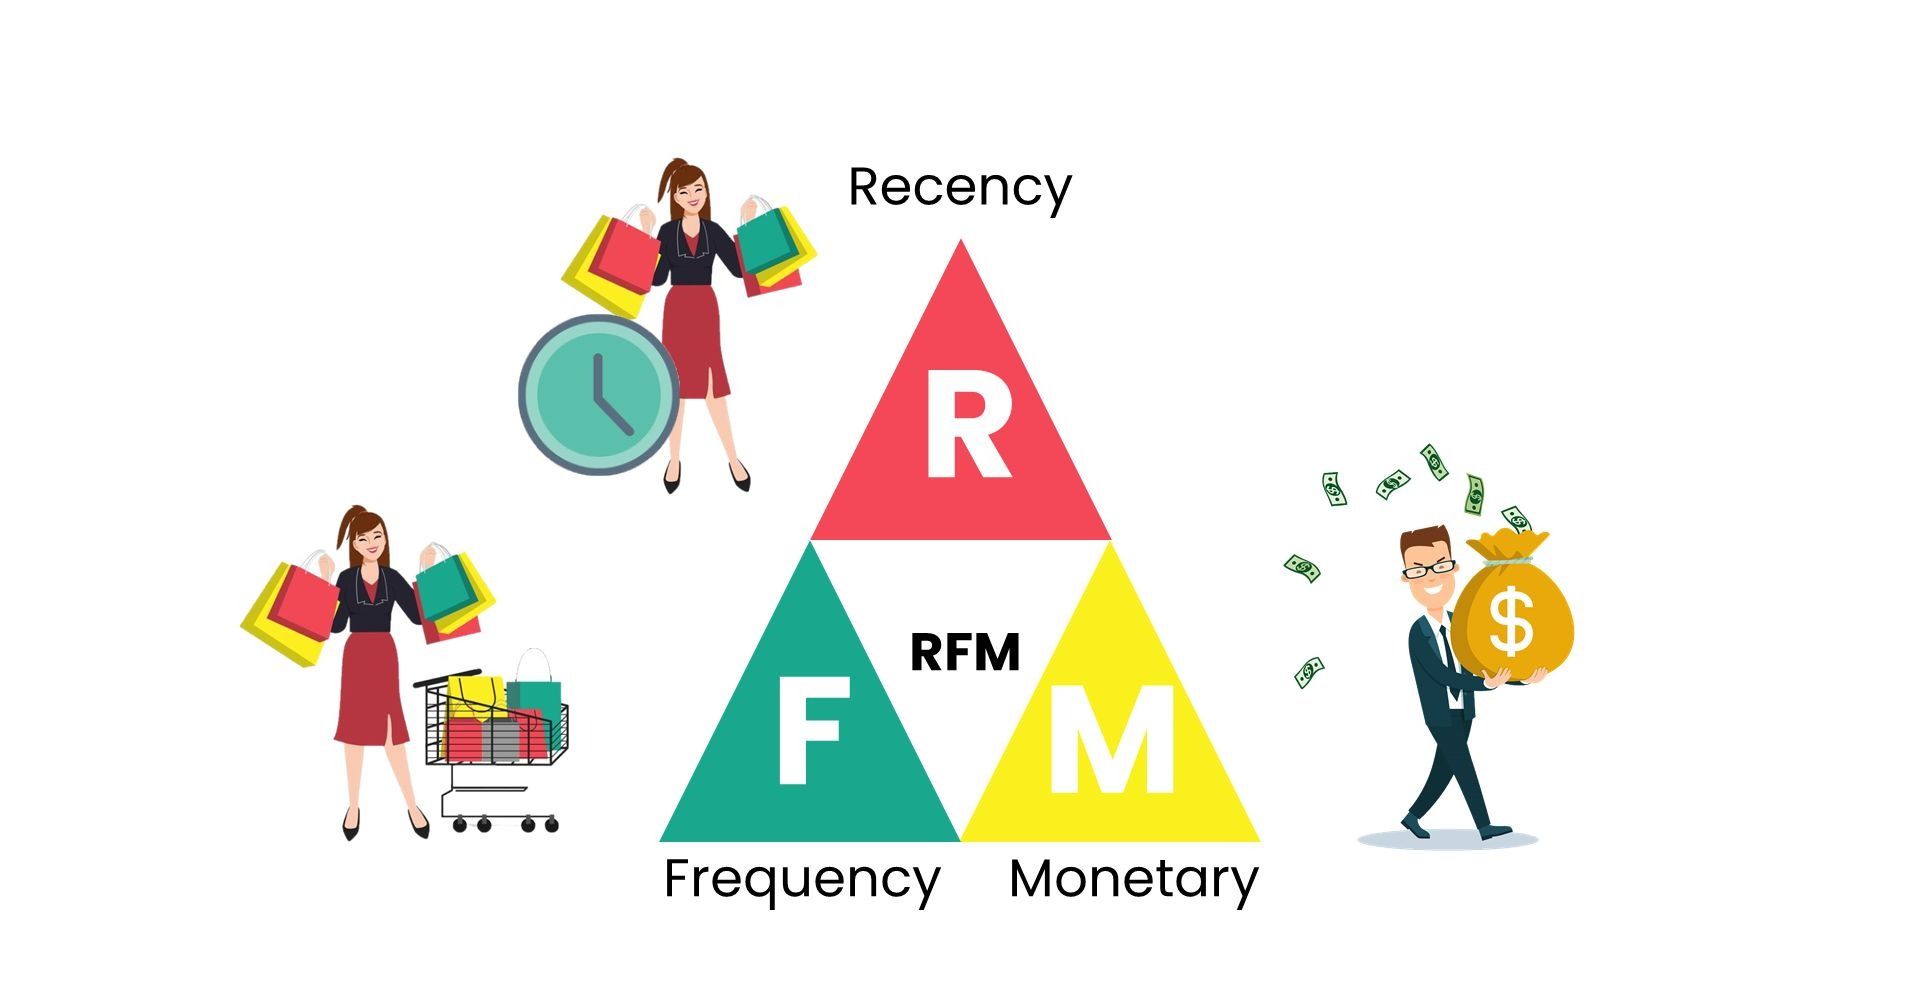 RFM analysis is a data-driven customer segmentation technique that allows marketing professionals to take tactical decisions based on severe data refining
169. A Complete(ish) Guide to Python Tools You Can Use To Analyse Text Data
 Exploratory data analysis is one of the most important parts of any machine learning workflow and Natural Language Processing is no different.
170. Are There Any Price Manipulation Patterns In Qatar 2022 Token?
 Today, let’s dig deep into another significant indicator to learn more about the trading volume of QATAR 2022 TOKEN.
171. How Different Analyst Types Can Positively Impact Your Small Business
 Data analysis used to be considered a luxury of big business.
172. Open Source is the Only Way to Address the Long Tail of Integrations
 Wouldn’t it be great to bring the time needed to build a new data integration connector down to 10 minutes? This would definitely help address the long tail of
173. 4 Data Analytics Certifications That Boost Your Career
 The best data analytics certifications, which will provide you with the right kind of guidance to boost your big data analytics career and to get a great job.
174. New Power BI Features For More Streamlined Data Analysis
 Here are the new features of Power BI (unveiled at the Microsoft Ignite 2021) that can be absolutely beneficial for business users.
175. How to Build a Web Scraper With Python [Step-by-Step Guide]
 On my self-taught programming journey, my interests lie within machine learning (ML) and artificial intelligence (AI), and the language I’ve chosen to master is Python.
176. How to Build Machine Learning Algorithms that Actually Work
 Applying machine learning models at scale in production can be hard. Here's the four biggest challenges data teams face and how to solve them.
177. Understanding the tech behind Snowflake’s IPO and what’s to come
 By now you must have read quite a few articles about Snowflake’s absolutely mind-blowing and record-setting IPO. This article is not intended to speculate on whether the valuation makes sense or not, but rather help you understand the technological concepts that make Snowflake so unique, and why it has proven to be so disruptful for the data space in general and the data warehousing space in particular.
178. Tired of Dirty Data? It’s Time to Implement a Data Scrubbing Initiative
 Raw data coming in from various sources is often inherently dirty data, rife with factual errors, typos and inaccuracies. Left unattended, this data becomes a nightmare. Imagine having to pull a report only to realize it has duplicated data – not to mention half of them don’t even have valid phone numbers or addresses. Your boss is not going to be happy.
179. How to Aid Disease Research with a Biomedical Knowledge Graph
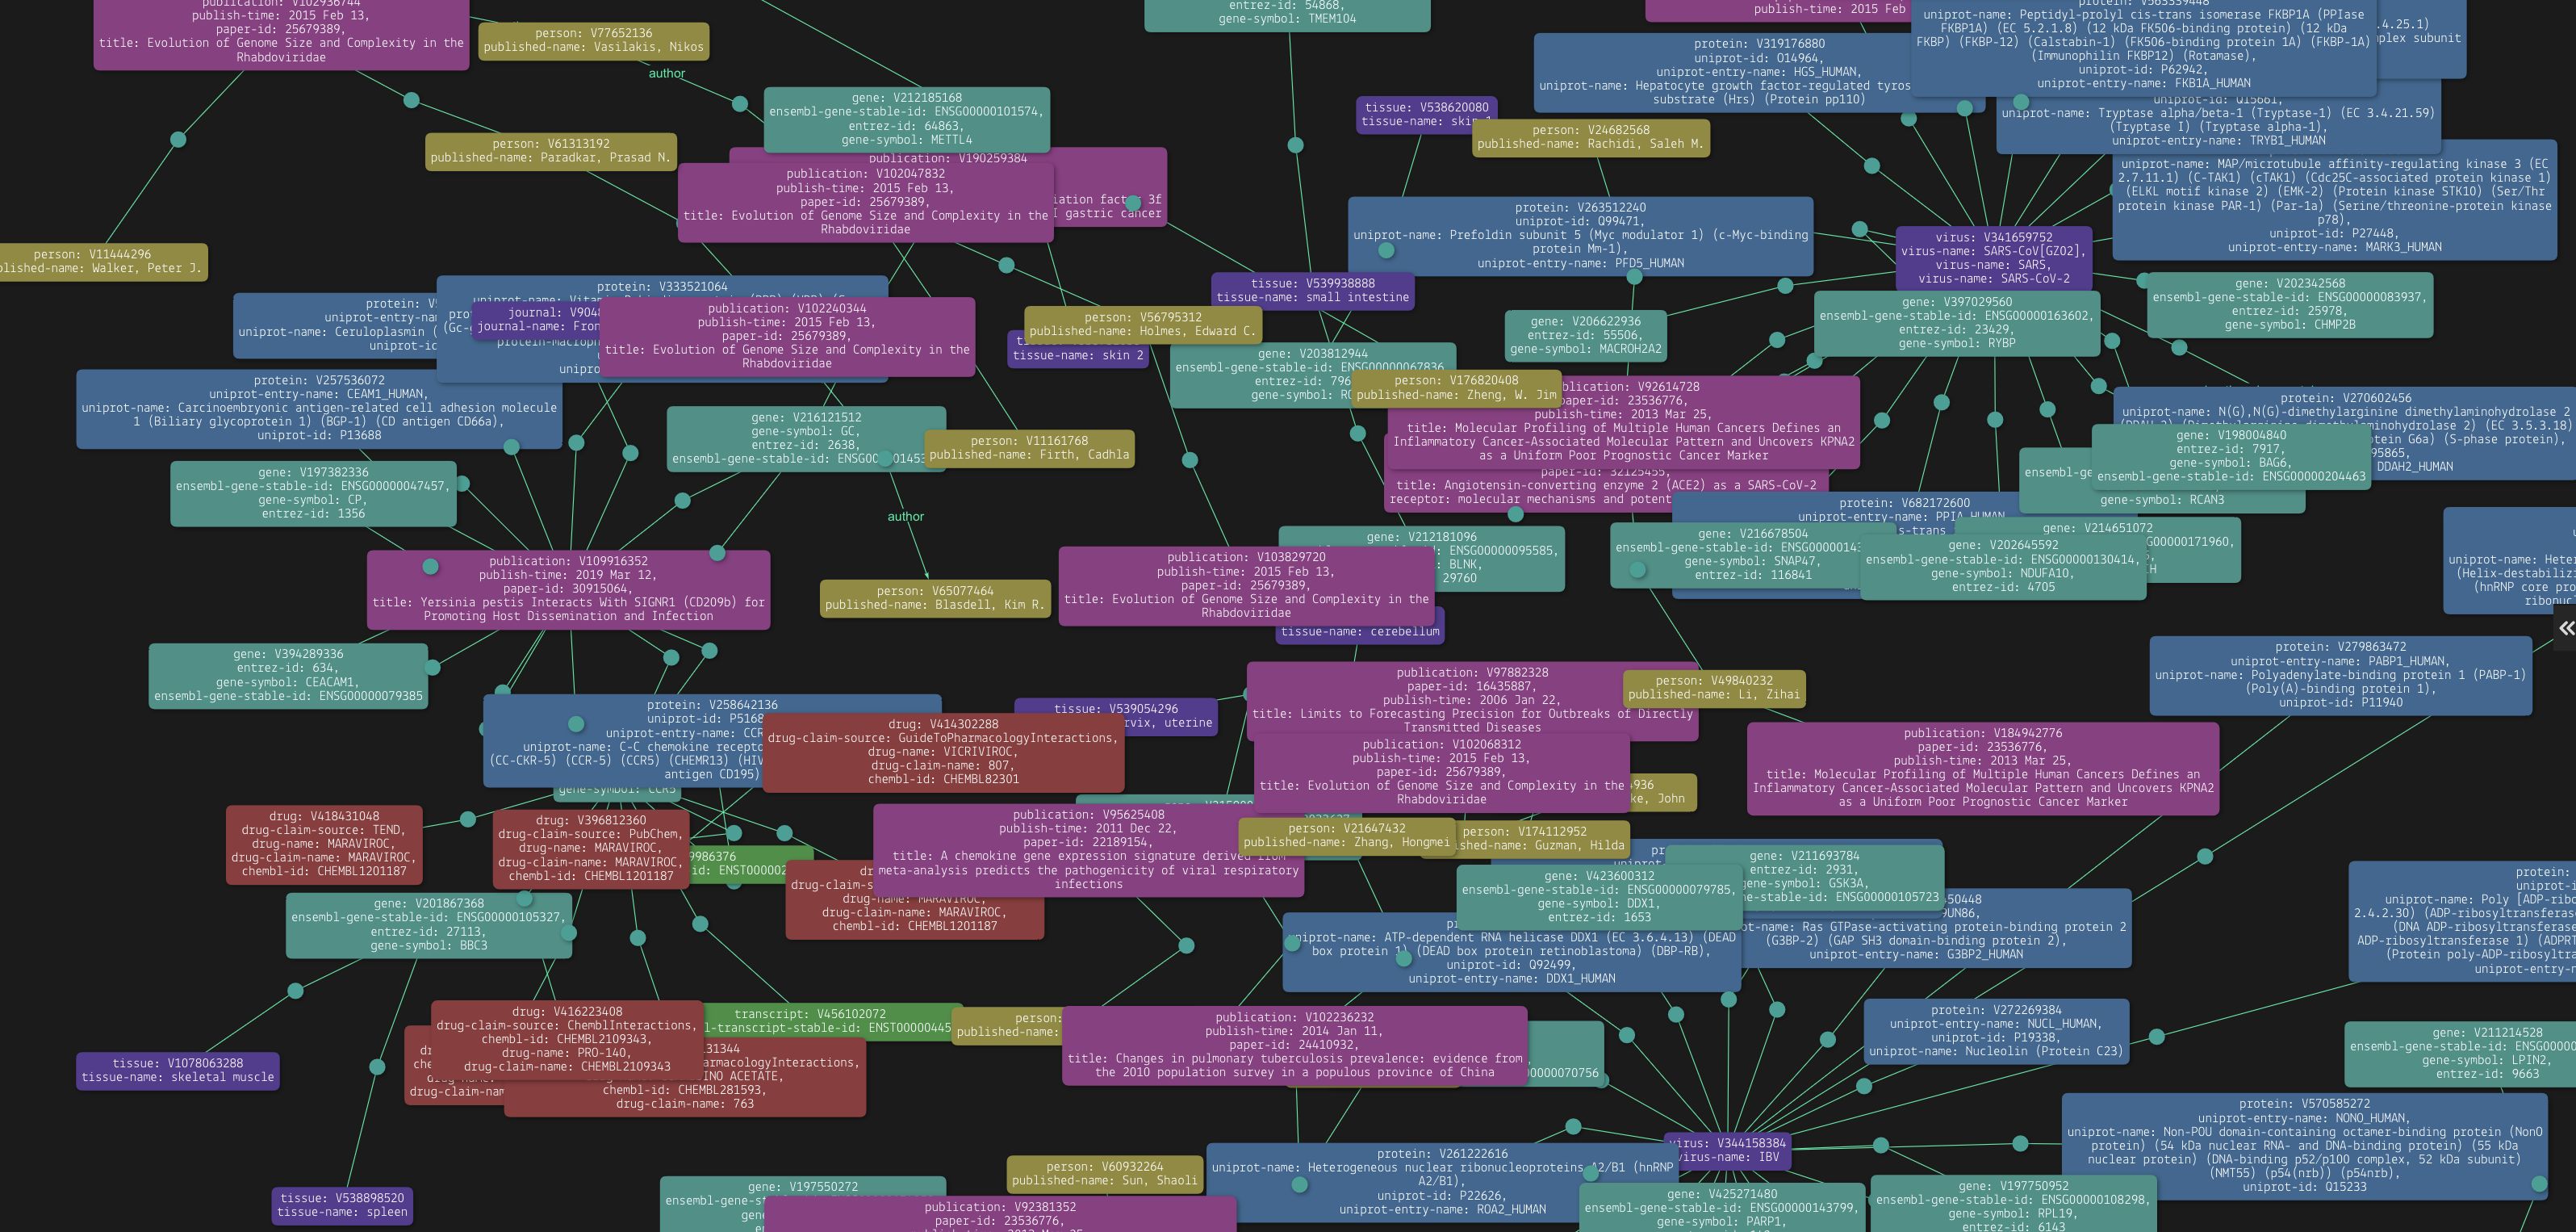 Building a biomedical knowledge graph using publicly available datasets to better aid disease research and biomedical data modelling.
180. How AI Has Enhanced Sentiment Analysis Using Product Review Data
 Customer feedback is great. But have you been able to turn that feedback into meaningful customer insights? A few years back, brands depended on surveys to gauge customers’ feelings about how their products were performing.
181. Embedded data analytics and reporting tools that empowers Business analysts
 Embedded data analytics and reporting tools that empowers Business analysts
182. Top 5 Business App Categories during COVID-19
 In the business world we have to do research and analysis to get to know what users/market have been looking for. So, here is one of our online analytics regarding the apps that are searched by users. We have been doing research on our test website name https://flutterappworld.com/ and i found that these imagine stat that help you to build apps with target markets that have most searches through Google. This stat is based on Google Website and Google analytics data.
183. A Single Speed Test is Fun — Hundreds of Them, May Actually be More Accurate
 Releasing the first internal build of the NordVPN apps that included NordLynx – our brand new protocol built on the backbone of WireGuard® – was an exciting moment for the team. Everyone started posting their speed test results on Slack and discussing the variance. While most of the time NordLynx outperformed other protocols, there were some cases with slightly worse speed results.
184. What Do Nobel Prize and Your Business Have in Common? Natural Experiments
 A natural experiment is a type of causal analysis that has been widely adopted by many organizations and research fields. How can you use them?
185. The Three Basic Benefits of a Virtual Data Room
 The popularity of online virtual data rooms has increased over the years. These are innovative software used for safe storage and sharing of files. As the world is modernizing, people are using advanced technology to carry out their daily tasks. As everything today is digital, it becomes more and more crucial to look for new methods to store files. Gone are the days when people used to pile up hard copies of all the files in the offices. Some people are still seen doing that which wastes half of their time. Imagine you have a business meeting in some time and you can’t find a specific file because there is a huge unorganized bundle of files in your office. With virtual data rooms, all your files are well organized. You do not have to get into a hassle of finding a certain file. With just one click, the file appears in front of you in no time.
186. Making Sense of Unbounded Data & Real-Time Processing Systems
 A real-time processing architecture should have these logical components to address event ingestion & processing challenges, such as a stream processing system.
187. Using Dynamic Pricing to Internationally Scale an eCommerce Business
 Be profitable from the first minute with dynamic pricing adapted to each market
188. How to Improve VC Deal Sourcing Using Public Web Data
 Learn how public web data can help you improve your deal sourcing methods.
189. 5 Real Ways to Start Implementing AI in your Ecommerce Stores
 The implementation of AI in ecommerce should come as no surprise. Online businesses have always been quick to adopt new technologies, and this is how the industry thrives; enhancing the customer experience, discovering new markets, and driving further sales. And with the continued development of AI technology like chatbots, visual search, and personalized recommendations, the world of ecommerce is transforming again.
190. Top 5 Factors Behind Data Analytics Costs
 A custom integrated data analytics solution would cost at least $150,000-200,000 to build and implement.
191. COVID-19: How to Set a Strong Recovery Strategy for Your Non-Profit

192. What Is Modern Business Intelligence?
 This article gives insight into some basic features and functionality that a desirable modern BI software has and illustrated some examples.
193. 4 Valuable Lessons I Learned as a Data Science Student
 I never really wanted to learn data science.
194. The Notions behind “Model-Based” and “Instance-Based” Learning in AI & ML
 A prelude article elucidating the fundamental principles and differences between “Model-based” & “Instance-based” learning in the branches of Artificial Intelligence & Machine learning.
195. Data Scientist Careers at Amazon: What You'll Earn, Learn, and Work On
 Find out what it means to be a data scientist at Amazon! Their salaries, roles and required experience, types of data positions, and interview process.
196. How a Customer 360 and Dgraph Cloud Can Help Improve User Retention
 Successful corporations leverage a customer 360. Check out how Dgraph can provide top-notch analyses quickly and effectively.
197. 2.6 Million Domains and ~45,000 Exposed Phpinfo() Later… the Story of Unprotected Phpinfo()
 A scan of over 2.6 million domains for exposed phpinfo() data from PHP and the analysis of what was found. Exposed database credentials is only the start.
198. Granger Causality: Principle of Cause and Effect Explained
 ... in a world full of data, we can understand the impact with clever methods. Meet Granger causality.
199. 3 Mistakes I Made Learning Data Journalism (and How to Avoid Them)
 Over the past decade, I’ve worked on and off as a journalist. It became clear to me early on that having some data skills might help me find interesting stories.
200. 6 Tips to Get More Value Out of Your Microsoft Power BI Dashboard & Reports
 By using Microsoft Power BI, you increase the efficiency of your company through its interactive insights and visual clues. Here are 6 tips for Power BI users.
201. How to Extract Insights From Your Data
 Manage data using the HarperDB database. Access your data from HarperDB using Custom Function. Automate EDA with data from the harperDB database using sweetviz.
202. Tencent Music Transitions from ClickHouse to Apache Doris
 Evolution of our data processing architecture towards better performance and simpler maintenance at Tencent Music.
203. Can a Data Scientist Drown a City in 3 Feet of Water?
 Yes, Let’s dive into the details.
204. Analysis And Prediction on HR Data Set for Beginners
 Are you a newbie when it comes to Data Analysis and Data modelling? If yes, then you are in the right place.
205. Applying Criminology Theories to Data Management: "The Broken Window Theory: and "The Perfect Storm"
 What can be done to prevent “Broken Windows” in the primary data source? How can we effectively fix existing “Broken Windows"?
206. Python Libraries For Data Science
 Top Data science libraries introduction of The Python programming language is assisting the developers in creating standalone PC games, mobiles, and other similar enterprise applications. Python has in excess of 1, 37,000 libraries which help in many ways. In this data-centric world, most consumers demand relevant information during their buying process. The companies also need data scientists for achieving deep insights by processing the big data.
207. Public Health Improvements as a Result of Data Usage and Analysis in Healthcare
 Big data has made a slow transition from being a vague boogie man to being a force of profound and meaningful change. Though it’s far from reaching its full potential, data is already having an enormous impact onhealthcare outcomes across the world — both at the public and individual levels.
208. Big Data: 70 Increíbles Fuentes de Datos Gratuitas que Debes Conocer para 2020
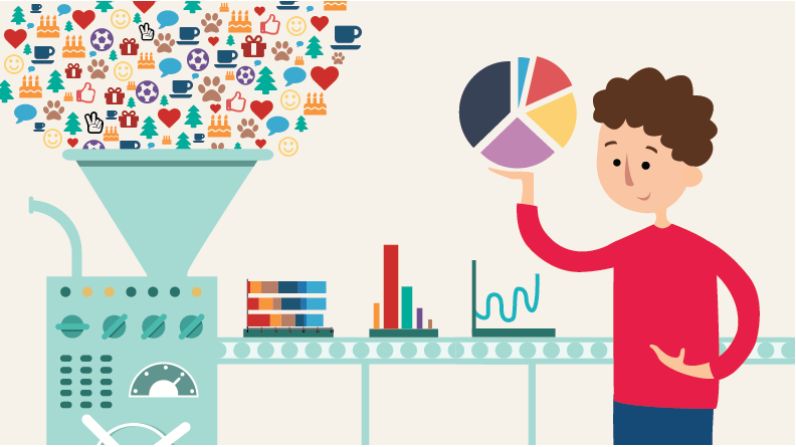 Por favor clic el artículo original:http://www.octoparse.es/blog/70-fuentes-de-datos-gratuitas-en-2020
209. Tire Manufacturers Are Rolling Out Consolidated Data Management
 In the tire manufacturing industry, conventional tools are no longer enough for handling the complexities of product data and can seriously damage your brand
210. Data Gathering Methods: How to Crawl, Scrape, and Parse Data Online
 The internet is a treasure trove of valuable information. Read this article to find out how web crawling, scraping, and parsing can help you.
211. Create A Data Visualization Map Using Mapbox
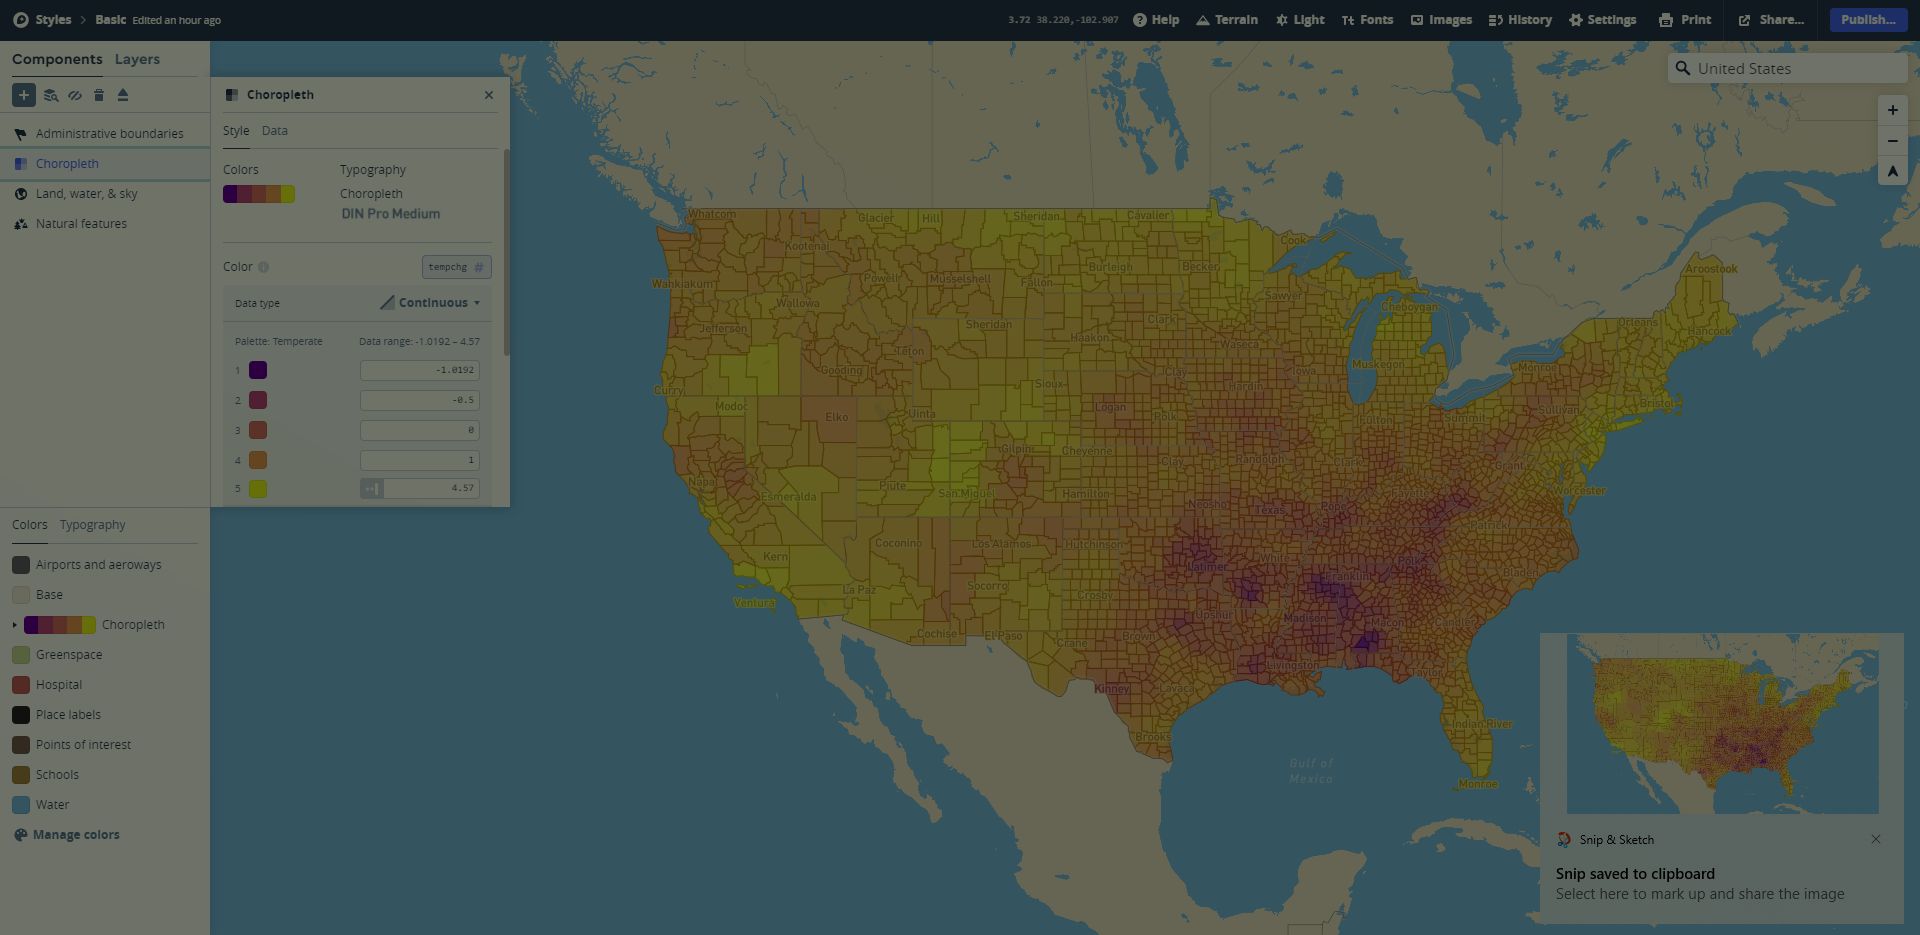 In this article, we make a map with a software called Mapbox in a few simple steps. This won't involve any coding at all!
212. Foundation Models - A hidden revolution in enterprise Artificial Intelligence
 An introductory article to bring a preliminary cognizance on the broadening prospects of foundation models in the AI industry.
213. Effective Tools To Make A Great Relationships Analysis in Game of Thrones [Part 2]
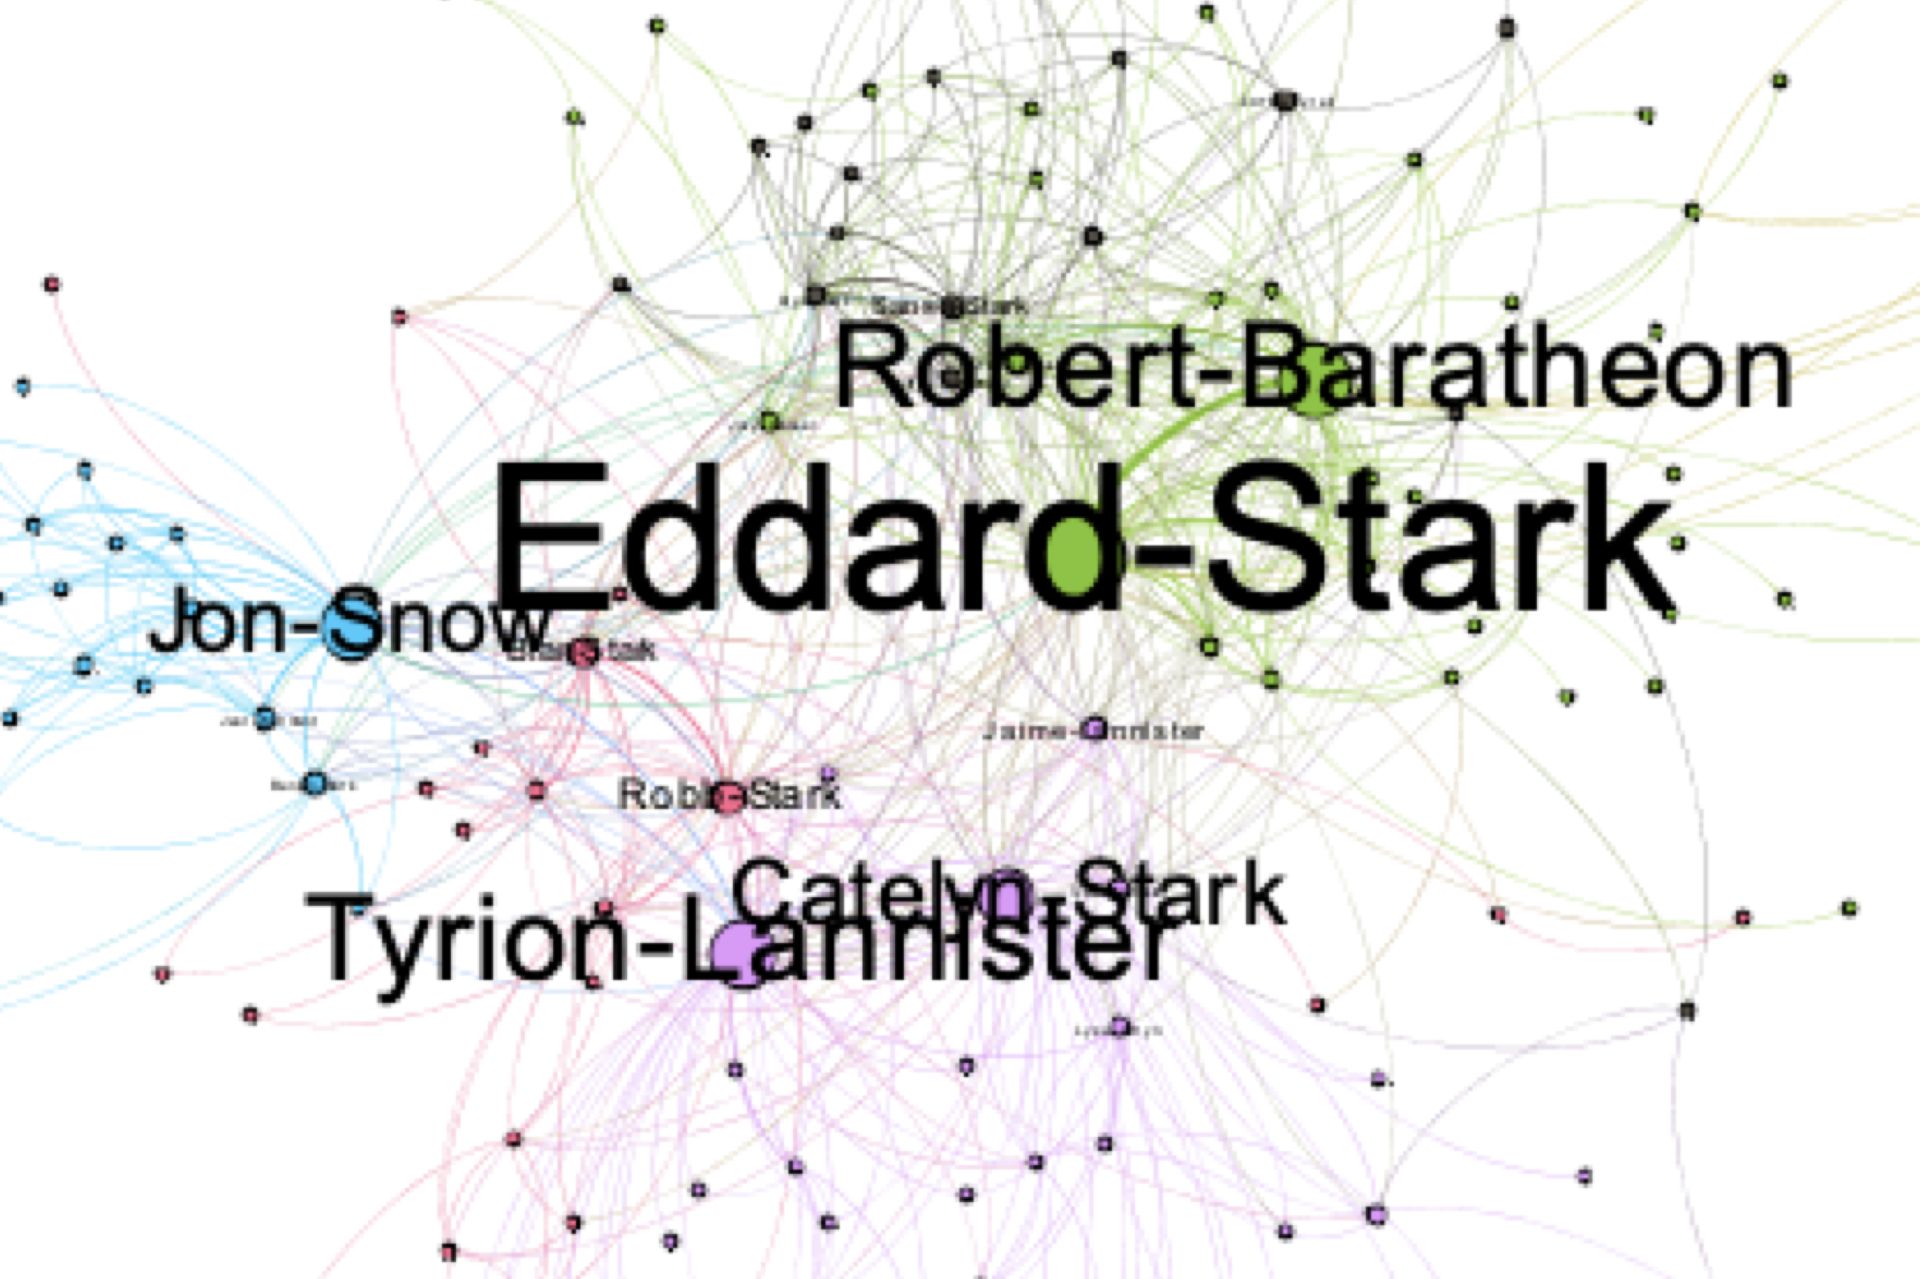 In the last post, we showed the character relationship for the Game of Thrones by using NetworkX and Gephi. In this post, we will show you how to access data in Nebula Graph by using NetworkX.
214. How to Install the KNIME Analytics Data Science Software
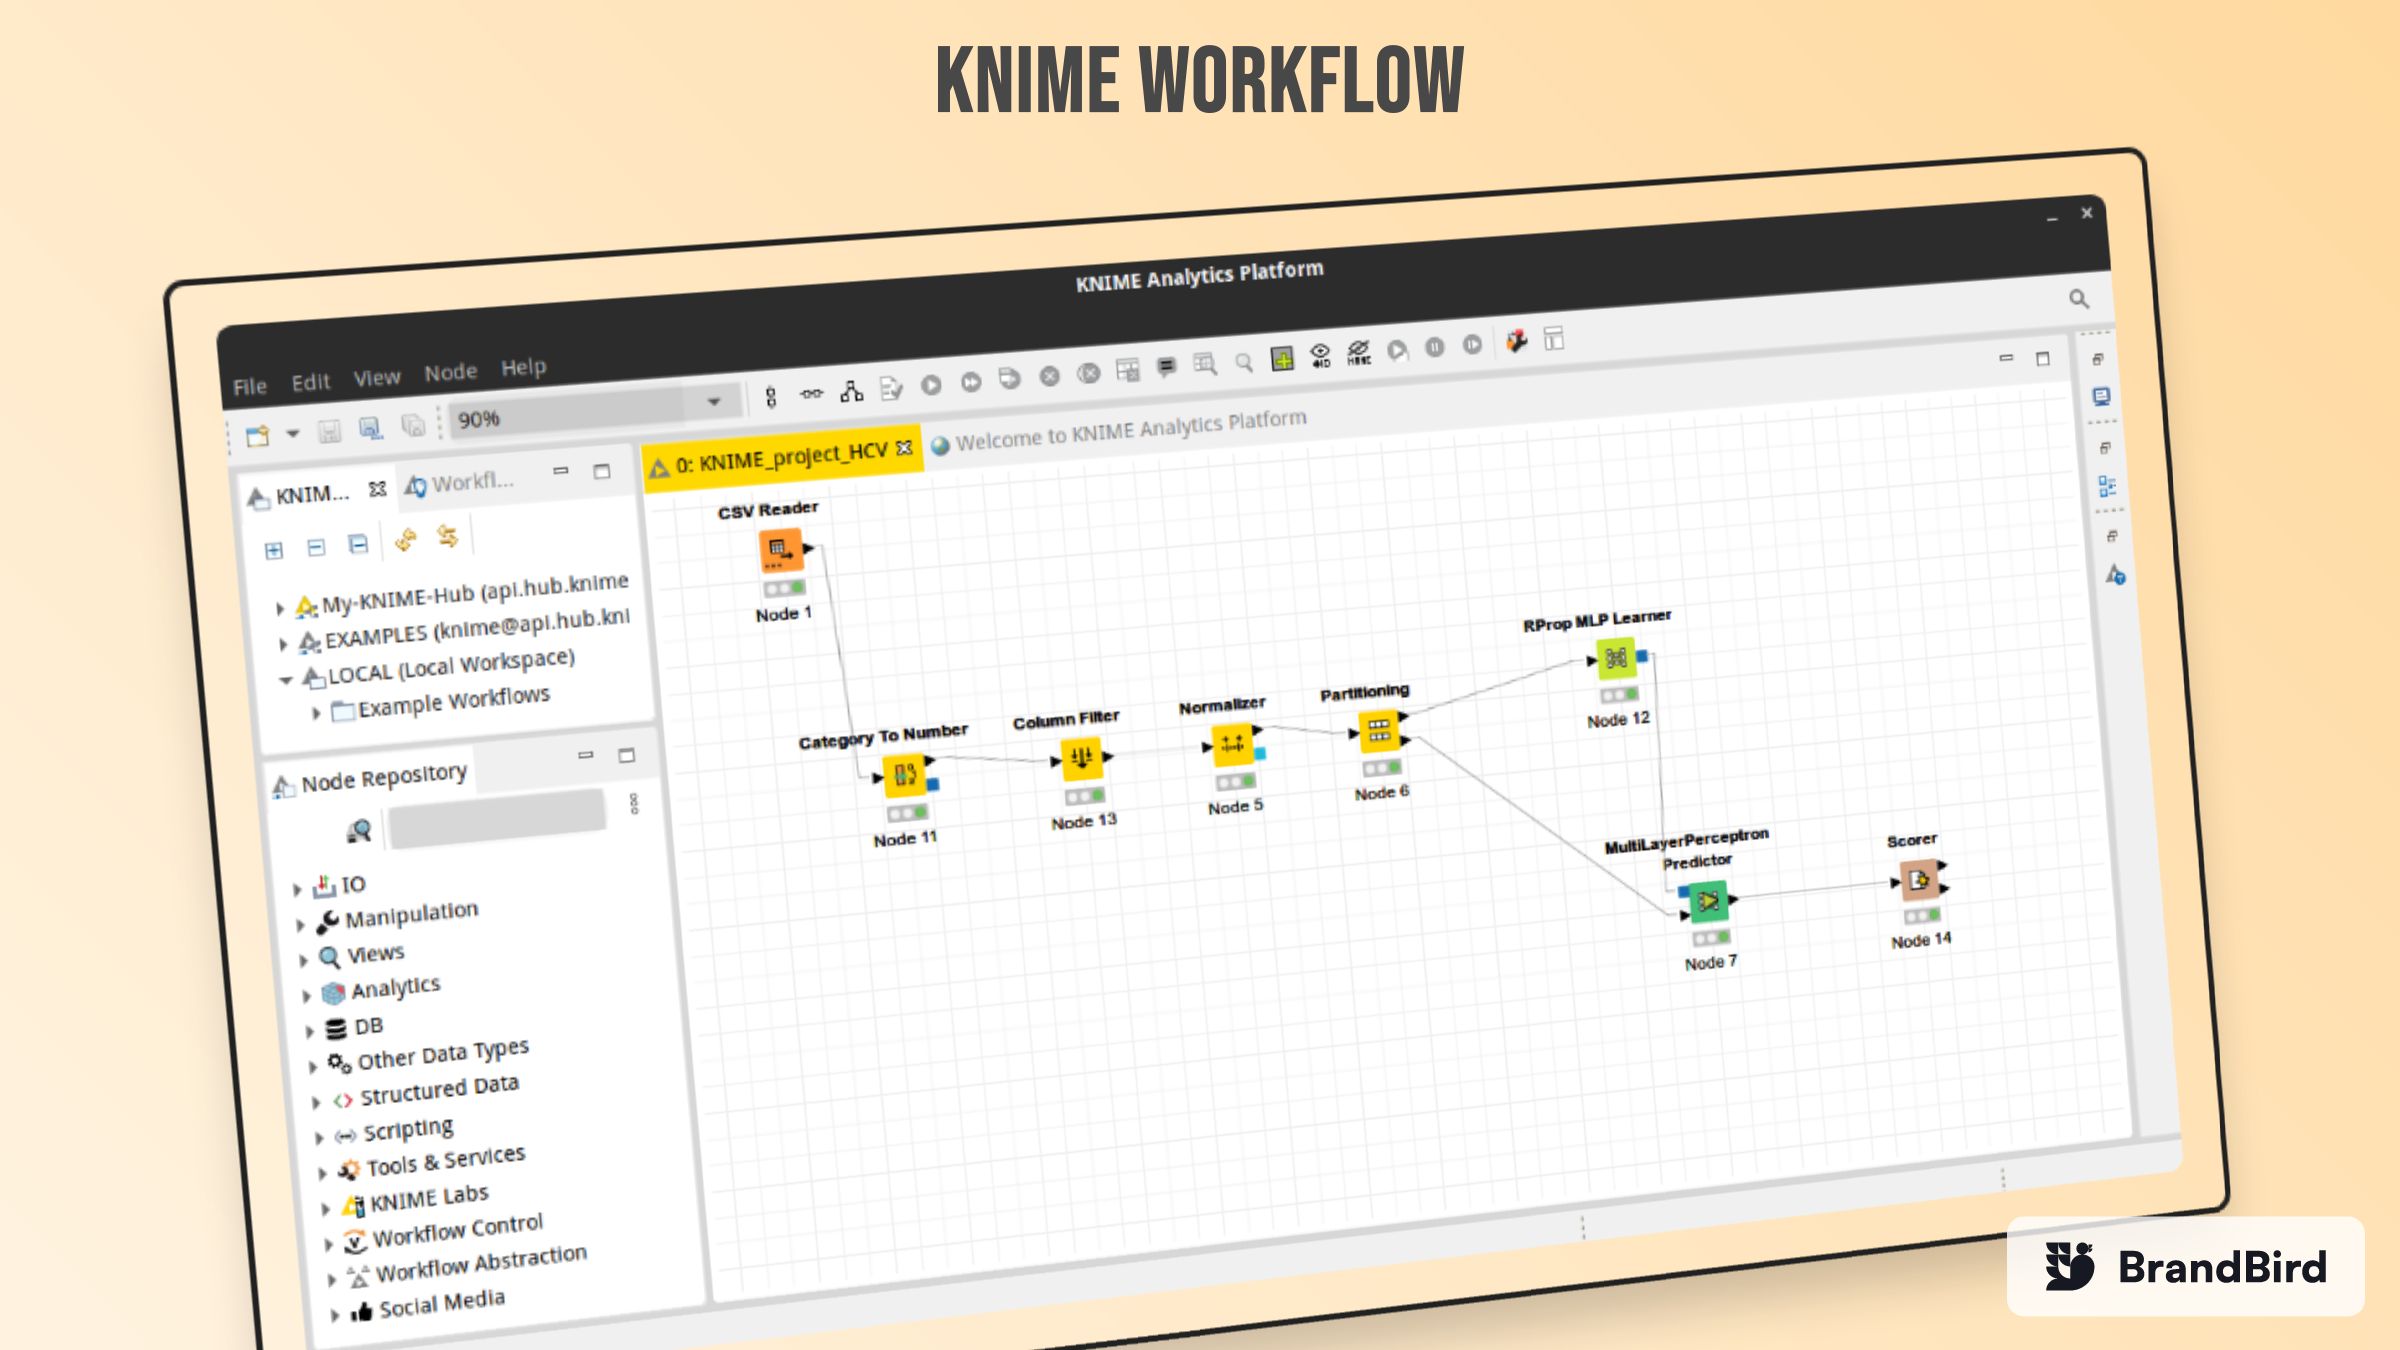 KNIME Analytics is a data science environment written in Java and built on Eclipse. This software allows visual programming for data science applications.
215. The Anatomy of K-means Clustering
 Let’s say you want to classify hundreds (or thousands) of documents based on their content and topics, or you wish to group together different images for some reason. Or what’s even more, let’s think you have that same data already classified but you want to challenge that labeling. You want to know if that data categorization makes sense or not, or can be improved.
216. We Built a Modern Data Stack for Startups
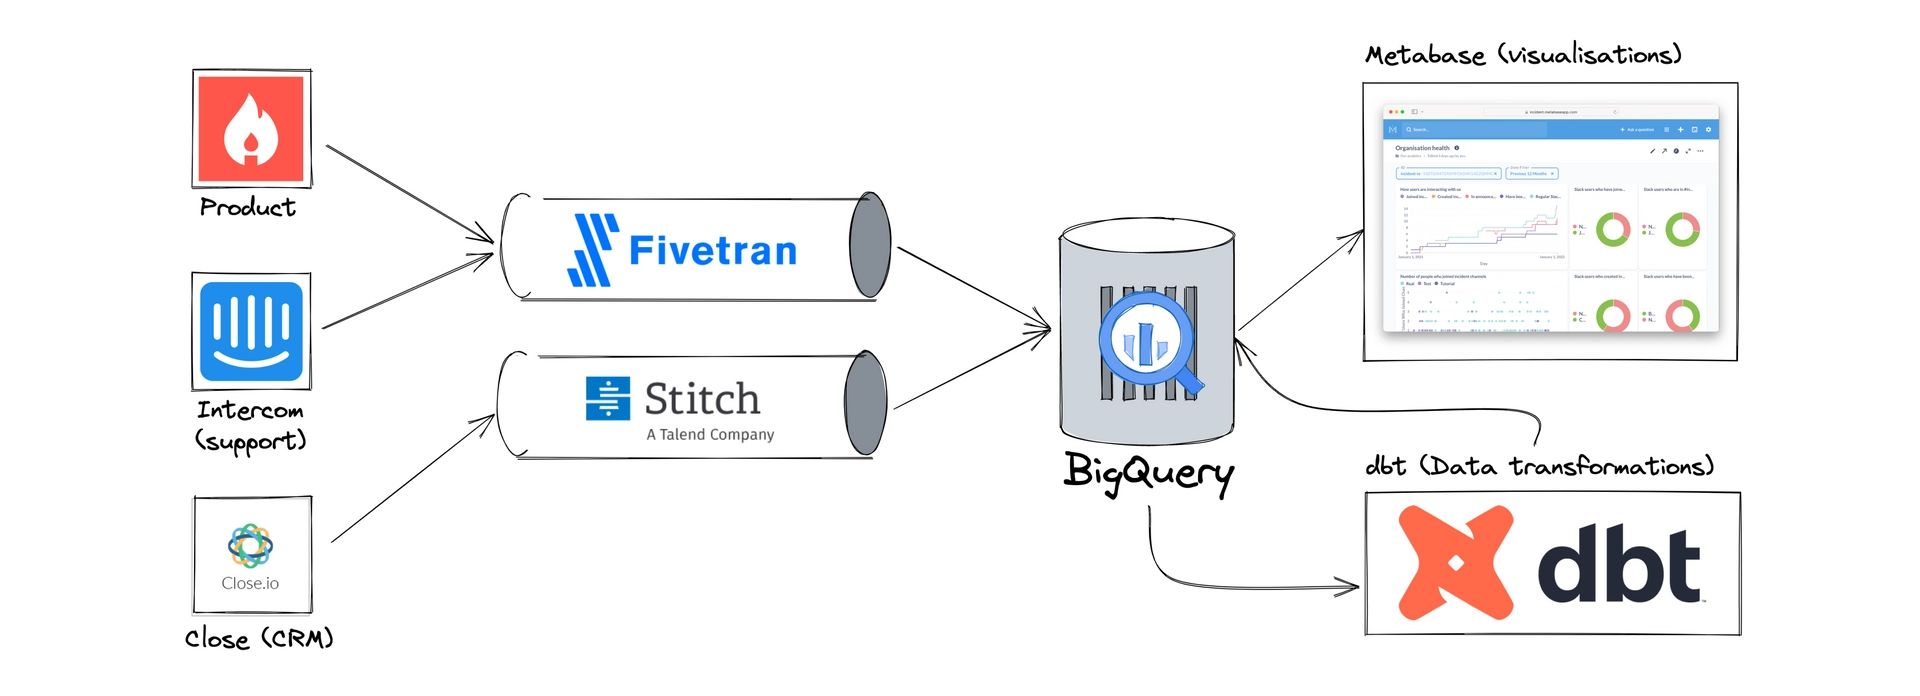 Here's how we built our data stack at incident.io. If you're a company that cares about data access for all, follow this guide and we guarantee great results.
217. Little-known Linear Regression Assumptions
 The model should conform to these assumptions to produce a best Linear Regression fit to the data.
218. The Pain Points of Scaling Data Science
 While building a machine learning model, data scaling in machine learning is the most significant element through data pre-processing. Scaling may recognize the difference between a model of poor machine learning and a stronger one.
219. How We Use dbt (Client) In Our Data Team
 Here is not really an article, but more some notes about how we use dbt in our team.
220. Automated Data Catalogs will Help Manage Data in 2022
 Data is increasingly playing a dominant role in business. Know how automating your data catalog can help with efficient data management in 2022.
221. A JavaScript Infographic: Data Science Salaries in 2022
 Data visualisation infographic with insights on salary level of data scientists - how to create the JavaScript dashboard and analyse its data
222. Interpreting Big Data: Data Science vs Data Analytics
 Data Science and Data Analytics are quite diverse but are related to the processing of Big data. The difference lies in the way they manipulate data.
223. Five Undervalued Data Points for Emerging Businesses
 Apparently, data has become more ubiquitous than the stars in the sky. In fact, the amount of data produced daily via the Internet is set to top 44 zettabytes. As you might assume, that’s more data than you could possibly fathom or use.
224. Augmented Analytics & Data Storytelling: Covid Ups FP&A Demand
 Businesses need agile tools to quickly identify and communicate actionable insights for more informed decision-making.
225. Low-Code Development Helps Data Scientists Uncover Analytical Insights
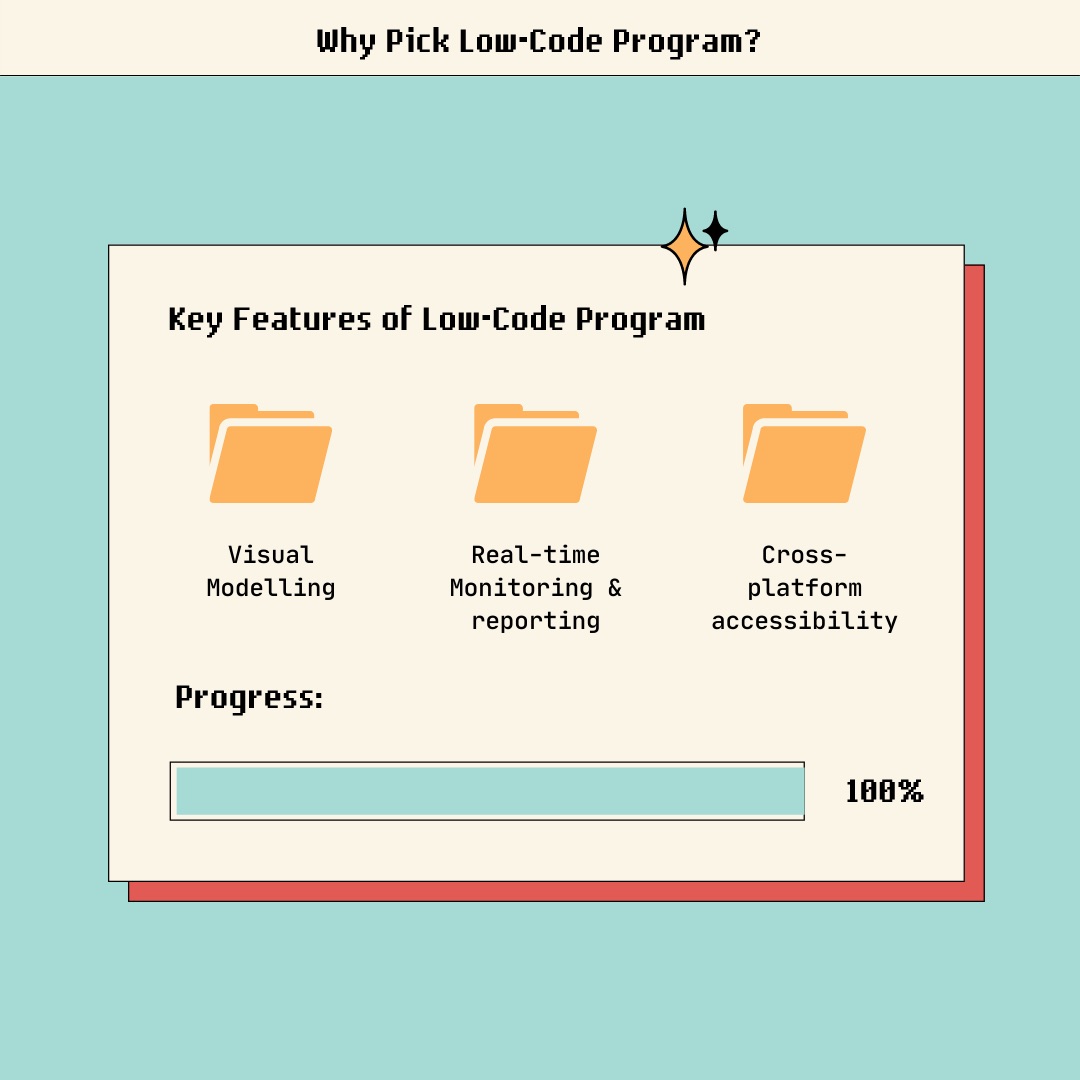 Emerging low-code development platforms enable Data Science teams to derive analytical insights from Big Data quickly.
226. I Tracked My Happiness Every Day For A Year
 I tracked my mental health each day throughout year. I rated my happiness on a scale of 1–5, with “1” being a really bad day, “2” being a kind of bad day, “3” being a neutral day, “4” being a kind of good day, and “5” being a really good day. I want to preface this article by saying that I understand how complex and difficult it is to try and quantify mental health. My absurdly simple, completely subjective, and inherently biased rating system is by no means an attempt to accurately represent the complexities of the mental health spectrum.
227. Geospatial Analysis of Movement Patterns for Mobility & Delivery

228. Disinfection Gateways: Could it Help Businesses Reopen?
 Reopening businesses after a public health crisis is a complex process that requires a consistent strategy to minimize all possible risks. Contrary to popular belief, it does not amount to disinfection and masks wearing and includes measures like monitoring and data analysis. The following article is an overview of disinfection tunnels and their implications for reopening businesses.
229. How to Build a Data Stack from Scratch
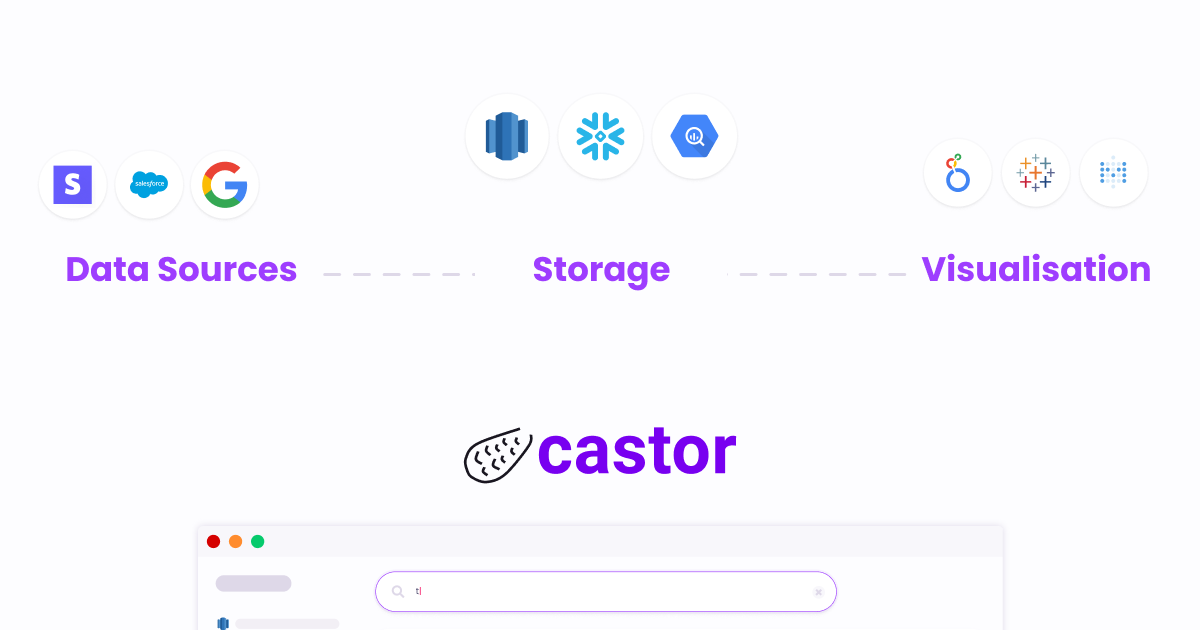 Overview of the modern data stack after interview 200+ data leaders. Decision Matrix for Benchmark (DW, ETL, Governance, Visualisation, Documentation, etc)
230. Data Journalism 101: 'Stories are Just Data with a Soul'
 Gone are the days when journalists simply had to find and report news.
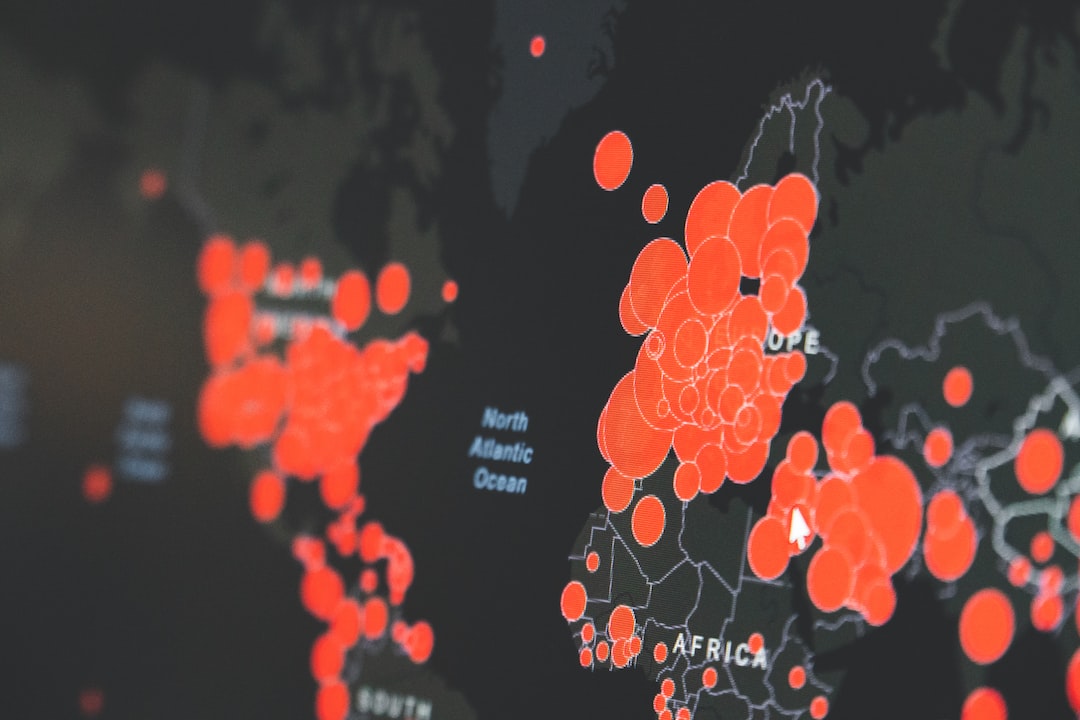
231. COVID-19: We Need More Than Data, We Need Insights!
232. 10 Ways to Optimize Your Database
 Take these 10 steps to optimize your database.
233. Popular Python Implementations [An Overview]
 You read it right. It's all about implementation. Today, we will talk about the different implementations of Python. A heads up on the different kinds, be it Cpython, Brython, you name it.
234. Querying Data With GraphQL & Ballerina
 Take look at the basics of GraphQL and how it is supported out-of-the-box with the Ballerina programming language.
235. A Framework & Package for Missing Data To Speed Up Data Organization and Data Cleaning
 Three weeks into my journey to become a data scientist and I’ve officially been baptized… by fire, that is! I chose to attend Flatiron’s Data Science 15-week bootcamp to transition out of finance. So far, the program has exceeded expectations (and my expectations were high).
236. Data Visualization
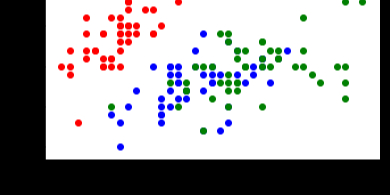 What is Data Visualization ?
237. Percentile Approximation Vs. Averages
 Get a primer on percentile approximations and why they're useful for time-series data analysis.
238. DeFi Data and Visualizations To Understand It 1% More Than Others

239. How To Predict Water Pumps Failure in Tanzania using CatBoost Library
 It is based on the competition data. An example of data analysis, insights from the data. The CatBoost library for the baseline model. High-score results.
240. Keep Sharing Context: How to Enable Better and Faster Product Decisions
 “So, what do you think?” — says the Product Manager after a product strategy presentation to his team
241. Top 3 Benefits of Insurance Data Analytics
 The Importance of data analytics and data-driven decisions across the board and in this case insurance data.
242. Native Analytics On Elasticsearch With Knowi
 Table of Contents
243. How Much Can You Make as a Data Scientist?
 Wondering how much data scientists make? We're here to help you find out about salaries in Data Science and how they are influenced by various factors.
244. Visualization of Hypothesis on Meteorological data
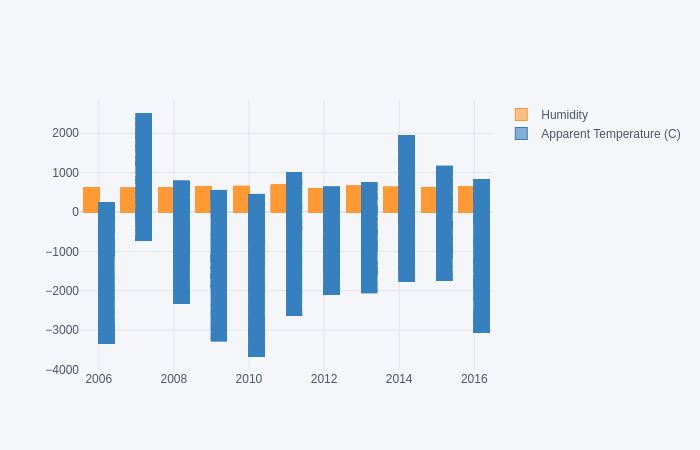 In this blog, we are gonna perform the analysis on the Meteorological data, and prove the hypothesis based on visualization.
245. A Guide to Growing your Average Order Value - A Price led Merchandising Segmentation Strategy
 The goal of the retail merchandising activity is to support a retail strategy that generates value for the customers. The selection of the merchandise and the type of goods are the key of the retail strategies. According to author Michael Levy in Retailing Management, the decision to carry particular merchandise is tactical rather than strategic.
246. Is Your Data Biased? How To Overcome Survivorship Bias
 In this post, we study the Survivorship bias — the danger to concentrate your data analysis solely on existing power users
247. A Look at the Trends in Developer Jobs: A Meta Analysis of Stack Overflow Surveys
 I'm really interested in the trends we see in the software engineering job market.
248. White Employees Are Heavily Over-Represented In Tech Leadership
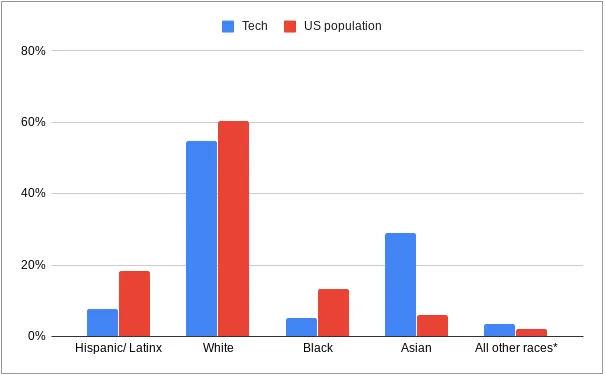 I collected and analyzed employment data by race for 57 of the biggest tech employers in the US (1). Here are the top level conclusions:
249. Getting to Know Google Analytics 4: Four Smart Features You Don’t Know About
 Let’s take a deeper look into Google Analytics 4 and explore some of its key features that you might not yet know about.
250. The Noon Notification—Monday 10 February, 2020
 The best tech stories published on hackernoon.com in the last 48 hours. Sign up for the newsletter today.
251. Staring into the Black Mirror with The Most Connected Man on Earth
 All throughout his day, Chris is connected to numerous sensors that collect the data that make up his life.
252. Analyzing Montreal’s BIXI Ridership With Data And Visuals
 Been to Montreal? Have you heard of the term bixi? Well, this article will educate you about bixi ridership and the factors that affect it.
253. Can Machine Learning Predict Loan Defaults?
 Visualize Insights and Discover Driving Features in Lending Credit Risk Model for Loan Defaults
Thank you for checking out the 253 most read stories about Data Analysis on HackerNoon.
Visit the /Learn Repo to find the most read stories about any technology.

