Let's learn about Monitoring via these 171 free stories. They are ordered by most time reading created on HackerNoon. Visit the /Learn Repo to find the most read stories about any technology.
It's important to keep an eye on your software... The Debugging Writing Contest is sponsored by our good friends at Sentry. Share your debugging stories and win from $1000 monthly prize pool!
1. How to Solve the Python Memory Error
 A memory error occurs when an operation runs out of memory. It’s most likely because you’re using a 32-bit Python version.
2. Declutter Your Code!
 The reason why you should regularly declutter your code is that doing so saves you from having confusing bugs that are caused by unwanted pieces of code.
3. A Simple Introduction to Software Development
 Software development is a very lengthy process. It includes a lot of research and design, which is necessary for the project's success
4. How to Fix Flaky End-to-End Tests with Playwright and Reflow
 A software engineer codes for 18 months and builds a SaaS. He thinks he knows how to improve end-to-end testing.
5. Dashboards, monitoring and alerting — right from your terminal !!!
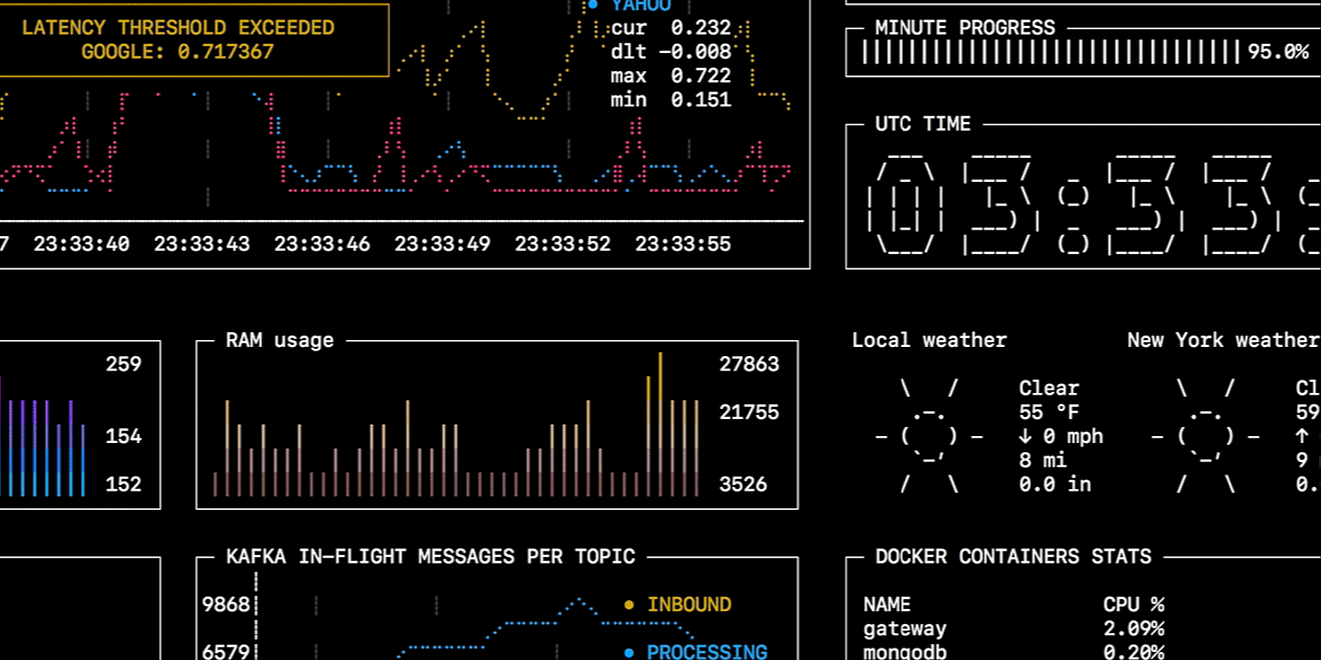 As a backend developer, I always need to monitor something. State machine in the database, records count, message queue lag, custom application metrics, system performance, progress of my deployment scripts. Tons of stuff!
6. Overcoming The Most Frequent Monitoring Challenges Engineers Face
 Let’s look at some most frequent monitoring challenges that engineers face, along with monitoring IT tools and how these can be resolved.
7. My Prometheus is Overwhelmed! Help!
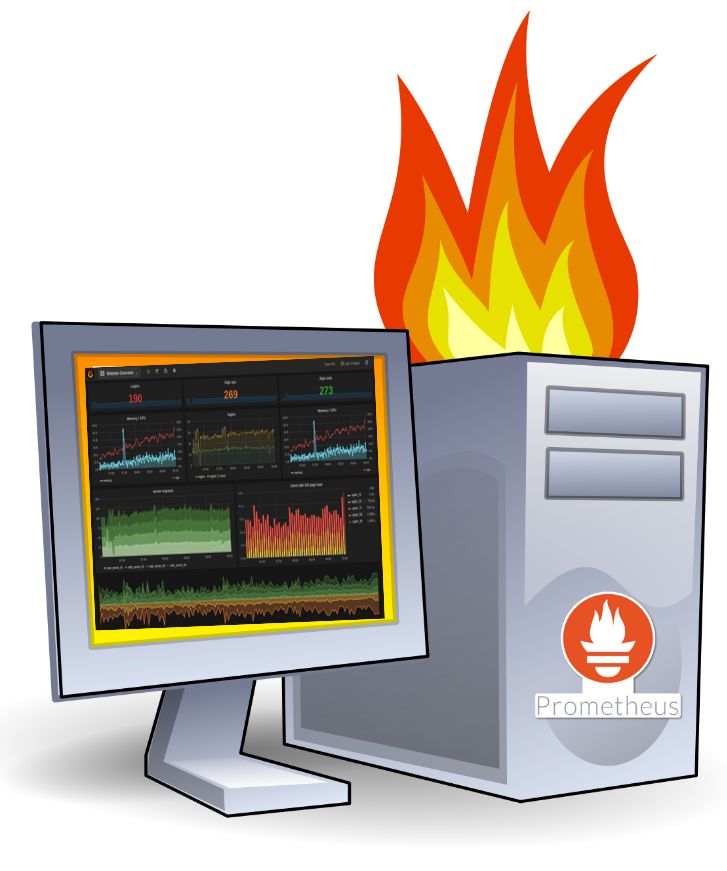 Your prometheus monitoring setup is grinding to a halt? You've thrown too much data at it? Don't worry, there's ways to fix this.
8. Top 3 Online Mentoring Platforms For Startups
 Stop passive learning and hack your growth with a mentor
9. How to Hack Text Messages via SMS Tracker Apps
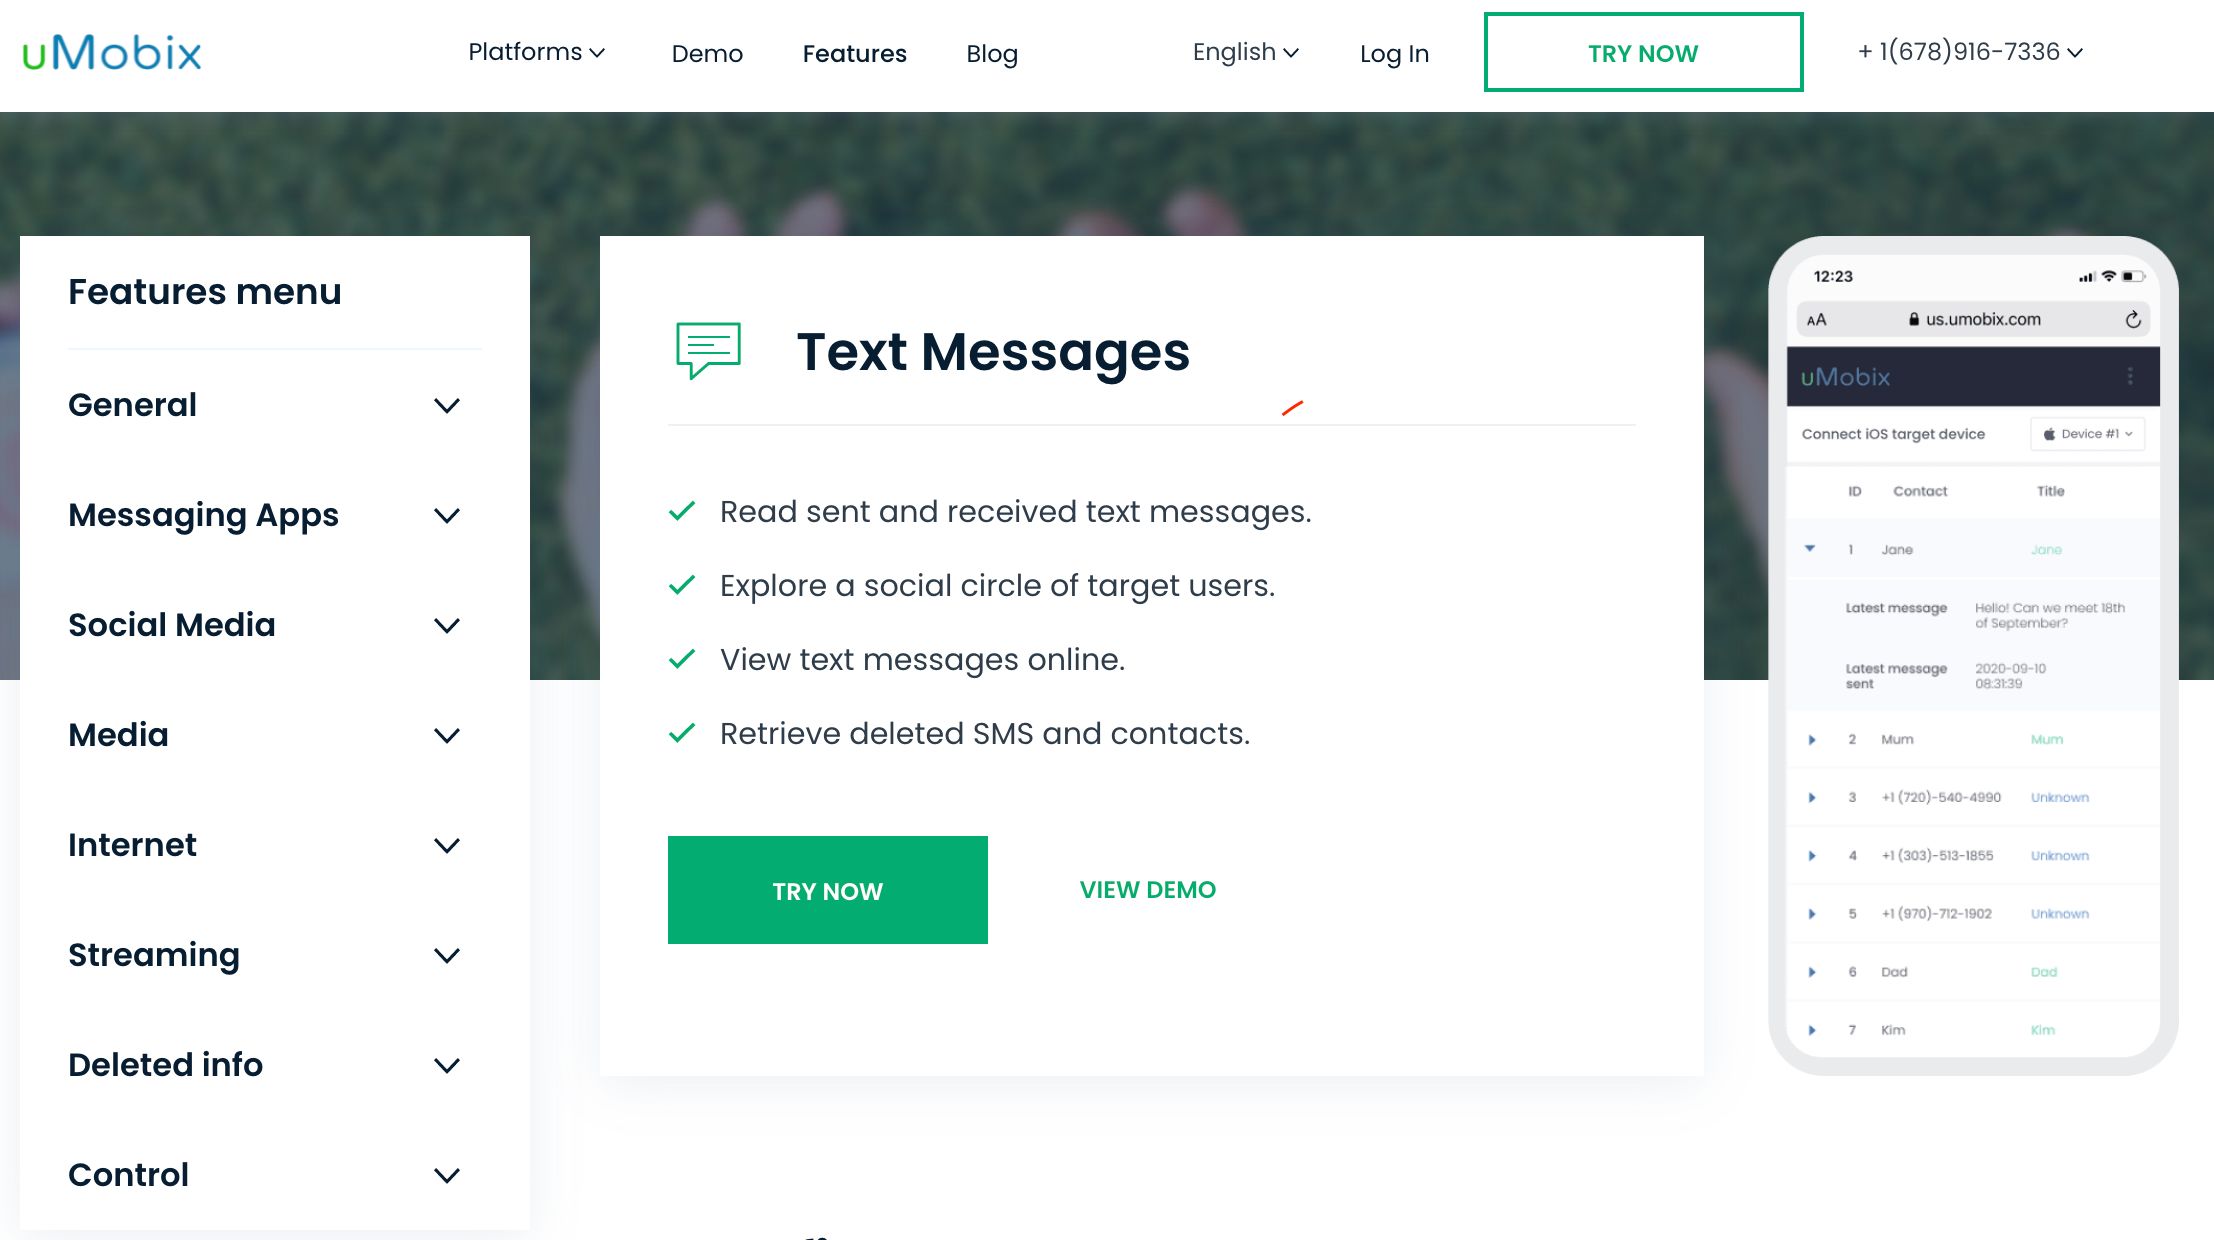 SMS tracker apps come with a wide range of valuable features, and they are usually quick and easy to install.
10. AWS CloudWatch Synthetic Service Introduction and Quick Tips To Start
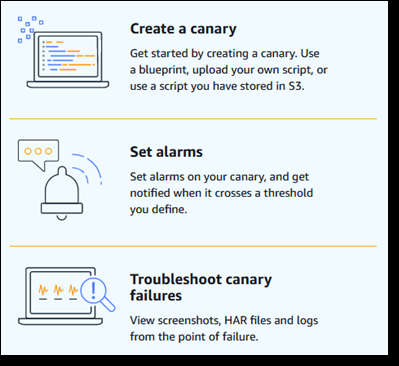 AWS just released CloudWatch Synthetic service a few days ago.
11. A Better Way to Monitor Your Laravel Services
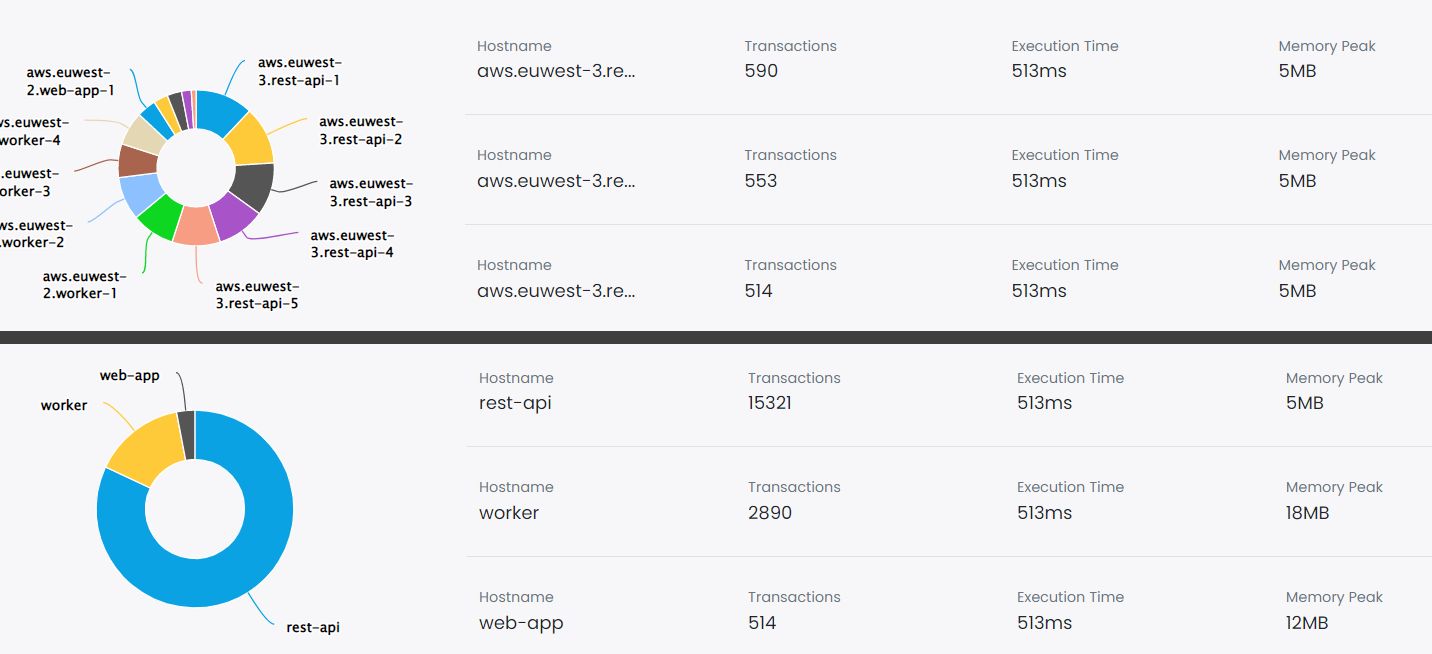 Kubernetes or auto scaling can create a bit of mess in your monitoring data. Learn how to monitor your Laravel application by services instead of hostnames.
12. Taming Big Tech: The Case for Monitoring
 <em>How, working in the shadows of the internet, researchers developed a passive monitoring system that might soon make Big Tech companies accountable to the public — and even save democracy.</em>
13. A Cheat Sheet to Understand Web Content Accessibility
 The idea of this post is to outline the most important aspects of accessibility, that’s why please treat it more like a cheat sheet than a compendium.
14. Using Cerbos to Navigate User Permissions
 Cerbos is an open-source decoupled access control for your software making user permissions and authorization simple to implement and manage.
15. 7 Ways to Optimize Your Agile Testing Strategy
 In this article, you will find some tips to streamline and improve your Agile testing strategy.
16. Risk Management in QA Teams: A Detailed Overview
 From preventing negative outcome to streamlining the entire development cycle, risk management play significant role. Read the blog to learn more.
17. Learn How to Make Java Classes More Consistent with Minimal Effort
 Learn how to make Java classes more consistent with a minimal effort.
18. How to Correctly Review Pull Requests
 Reviewing pull requests can and should be easy. But are your pull requests reviewed properly?
19. How to Monitor Apache Flink with OpenTelemetry
 Apache Flink monitoring support is now available in the open source OpenTelemetry collector.
20. The Role of Continuous Monitoring in DevOps Pipeline
 Continuous monitoring gives organizations near-instantaneous feedback and insights into performance, environments, and interactions across the DevOps pipeline.
21. Fixing The ClickHouse Node Failure On Distributed Systems - A How-To Guide
 Part One: ClickHouse Failures, by Marcel Birkner
22. Contest Prompt Questions: Debugging [Sample 1]
 Write about a time when you struggled (and later, triumphed!) to identify a bug or performance issue.
23. Optimizing SQL Queries With JPA Repositories
 Today I would like to talk about how you can optimize work with JPA repositories and improve performance by avoiding native SQL queries in the code.
24. Nested Changes in Vue: How to Watch Out for them
 In Vue, we sometimes want to watch for changes of properties within properties. In this guide, let's look at how to watch for nested changes in Vue.
25. Collecting and Shipping Windows Events Logs with OpenTelemetry
 If you use Windows, you want to monitor Windows Events. I'll show you how to easily monitor Windows Events with OpenTelemetry.
26. Get Started With Sidekick Open Source Live Debugger in 5 Mins
 Sidekick is a live application debugger that lets you troubleshoot your applications while they keep on running. Here is how you can start using it in 5 minutes
27. Comparing XML and Compose Rendering Speed at Deep and Wide Nesting
 There are many benchmarks that compare the performance and rendering speed of XML and compose.
28. Quality Assurance in Scrum Projects
 Scrum is a set of rules for organizing a flexible workflow, which consists of a team approach, working in iterations, focusing on the goal of each iteration.
29. Serverless monitoring — the good, the bad and the ugly
 Not so long ago, a job requirement pushed me into the world of FaaS, and I was thrilled. I had dreams of abstraction — eliminating all that tedious work no developer likes doing. “We are not operations engineers!” I exclaimed proudly. “We should not need to dabble in the dark arts of the Linux Shell.”
30. Turning Debugging into a Life-Long Mission
 Debugging is a means to tackle problems but what if it is possible to solve debugging itself?
31. Using Lightrun to Debug the Java Message Service (JMS) API
 Due to their asynchronous nature and production complexities debugging messaging systems is remarkably hard... WAS remarkably hard...
32. Why Every Software Development Project Needs a QA
 If you have a team of programmers, but there is still no QA specialist, read the article to learn about why building a successful startup needs a QA specialist.
33. How Observability and Monitoring Produces Better Software
 An article focused on deep diving into observability and its significance in software. Its history, goals, the importance of observability, and the issues that
34. How to Use ROP Vulnerability in PicoCTF Ropfu Challenge
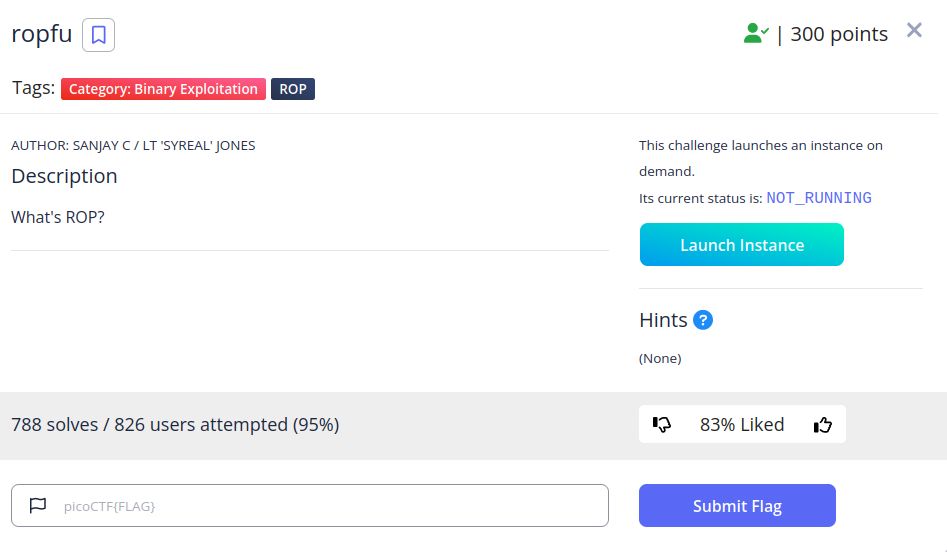 This is a write up for solving the picoCTF challenge 'ropfu' in binary exploitation category.
35. Test Driven Development (TDD): Killing Bugs Before Day Zero
 Here's why you need to know TDD craft.
36. Why and How to monitor Amazon API Gateway HTTP APIs
 Monitoring your HTTP APIs can transform your decision process with actionable information instead of guessing around user complaints and high bills.
37. Monitoring Bandwidth in Wi-Fi Networks: A Guide
 When building a WLAN infrastructure, you need to make a precise analysis of the bandwidth requirements to balance performance and cost correctly. Bandwidth plays a fundamental role in the design and maintenance of a functional network.
38. Solved a Software Performance Issue? Share Your Story and Win $$$!
 Hey Hackers! Do you have a kick-ass software performance story to share? Here’s your chance to win money from a $1000 monthly prize pool.
39. Observability vs Monitoring: What's the Difference?
 Monitoring has been a basic system to track the health of servers for years. Now it is not enough.
40. Debugging Gson, Moshi and Jackson JSON Frameworks in Production
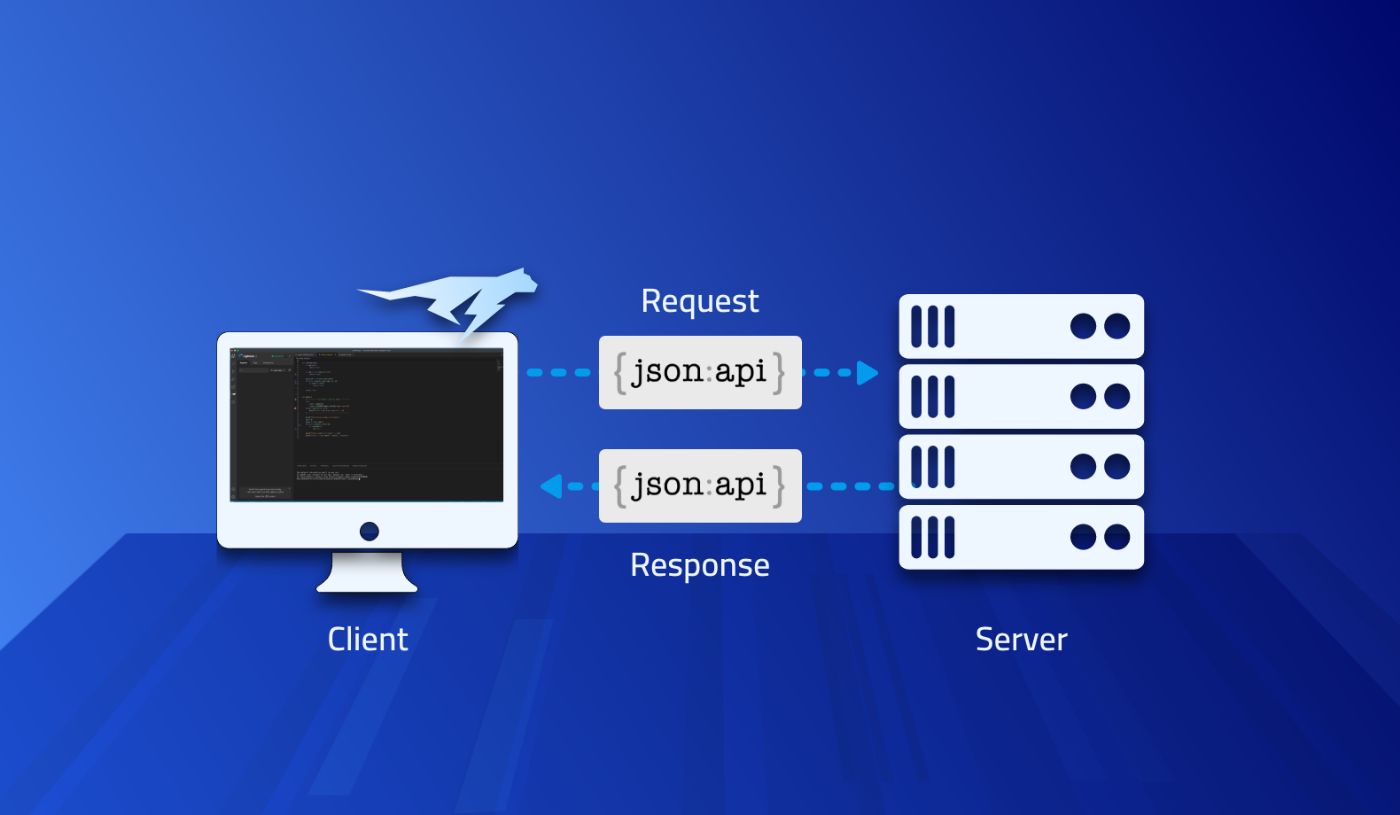 Parsing is a major source of production failures. Some are easy to track but some are insidious. Here's how you can debug them on the fly!
41. How to Stop Giving Away Money to AWS by Running KubeCF with Kind on MacOS
 I've reviewed how to deploy KubeCF on EKS, which gives you a nice, stable deployment of KubeCF, for cost. Now let's run KubeCF on your Mac for free(ish)!
42. Monitor Your AppSync GraphQL APIs with Simplicity
 Learn what and how to monitor AWS AppSync to manage your APIs for GraphQL, effectively log changes made in your apps and other essential features for devs.
43. Web Automation with Python and Selenium
 Web automation is one of the best ways companies can test a product in development, especially the app's functionalities, such as clicking, scrolling...
44. Microservice.add(observability) != Microservice.add(monitoring)
 You are reading this content, which means that you are not novice to the microservices field. So let me just scratch the surface of it before moving to Observable Microservices. Once upon a time Monolith Application was now transformed into Microservices based application.
45. Observability and Monitoring Have a Symbiotic Relationship, but They Are Different
 Observability vs. monitoring, what is the difference? Monitoring is the what to observability’s why. Here we dig into the differences.
46. Memory Debugging and Watch Annotations
 RAM profiling has its strengths and weaknesses. The debugger is the perfect complementary tool that translates obtuse statistics to actionable changes
47. Low Code Programming: Understanding the Future of Software Development with Zenity
 Michael Bargury spent years working on cloud security at Microsoft, bootstrapping security products that tackle emerging threats like IoT, APIs and IaC.
48. What should Automated Testing Look like for Kubernetes Apps?
 Microservices exponentially increase the number of connections and remote work is the norm - how do we ensure tightly integrated components play well together?
49. Better Performance and Security by Monitoring Logs, Metrics, and More
 Monitoring is a crucial part of observability. Learn how monitoring can specifically improve security, performance, and reliability.
50. Why it's Time to Stop Using Meaningless Test Values
 Did you ever find a test where the mock data was a bunch of meaningless "test" strings and 123 integer values? Yeah, me too — and it sucks.
51. How To Use Common Sense, HTML, CSS, and JS. To Make An Analogue Clock
 Simple steps to create an Analogue Clock project with HTML, CSS, and JS and what the project can teach you about the development process and documentation.
52. Lua-Land CPU Flame Graphs in OpenResty XRay
 This post will introduce the idea of Lua-land CPU flame graphs and use OpenResty XRay to produce real flame graphs for several small and standalone Lua examples
53. Why Your Monitoring Dashboard May Be Feeding You Phantom Metrics
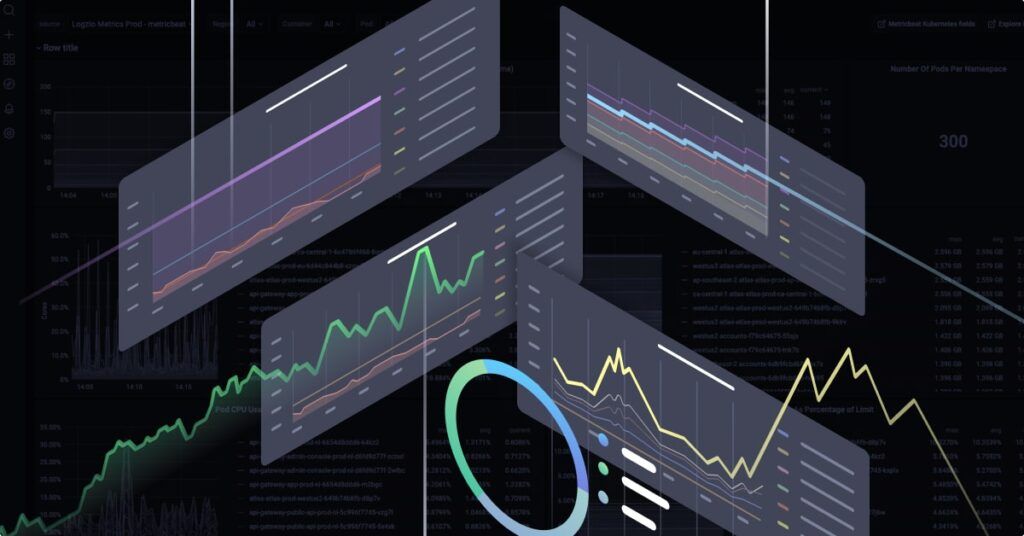 We trust our metrics to show us the status of our system and where it misbehaves. But do our metrics show us what really happened?
54. How to Debug Issues with the Java Collections Framework in Production
 Outside of the language itself, collections are the most basic building block for Java applications. How do we expose them for debugging?
55. Time to Rewrite your Git History Effectively with git reflog
 In this article, you'll learn how to utilize git reflog to re-organize and rewrite your Git commit history effectively and easily.
56. Murre - the lightweight K8s metrics monitoring tool

57. Understanding APIs and How to Test Them
 API (an abbreviation of Application Programming Interface) is a special interface (a set of commands/controls) that is designed for the interaction of different
58. ⛓ Check the first ML Value Chain Landscape shaped by ML practitioners!
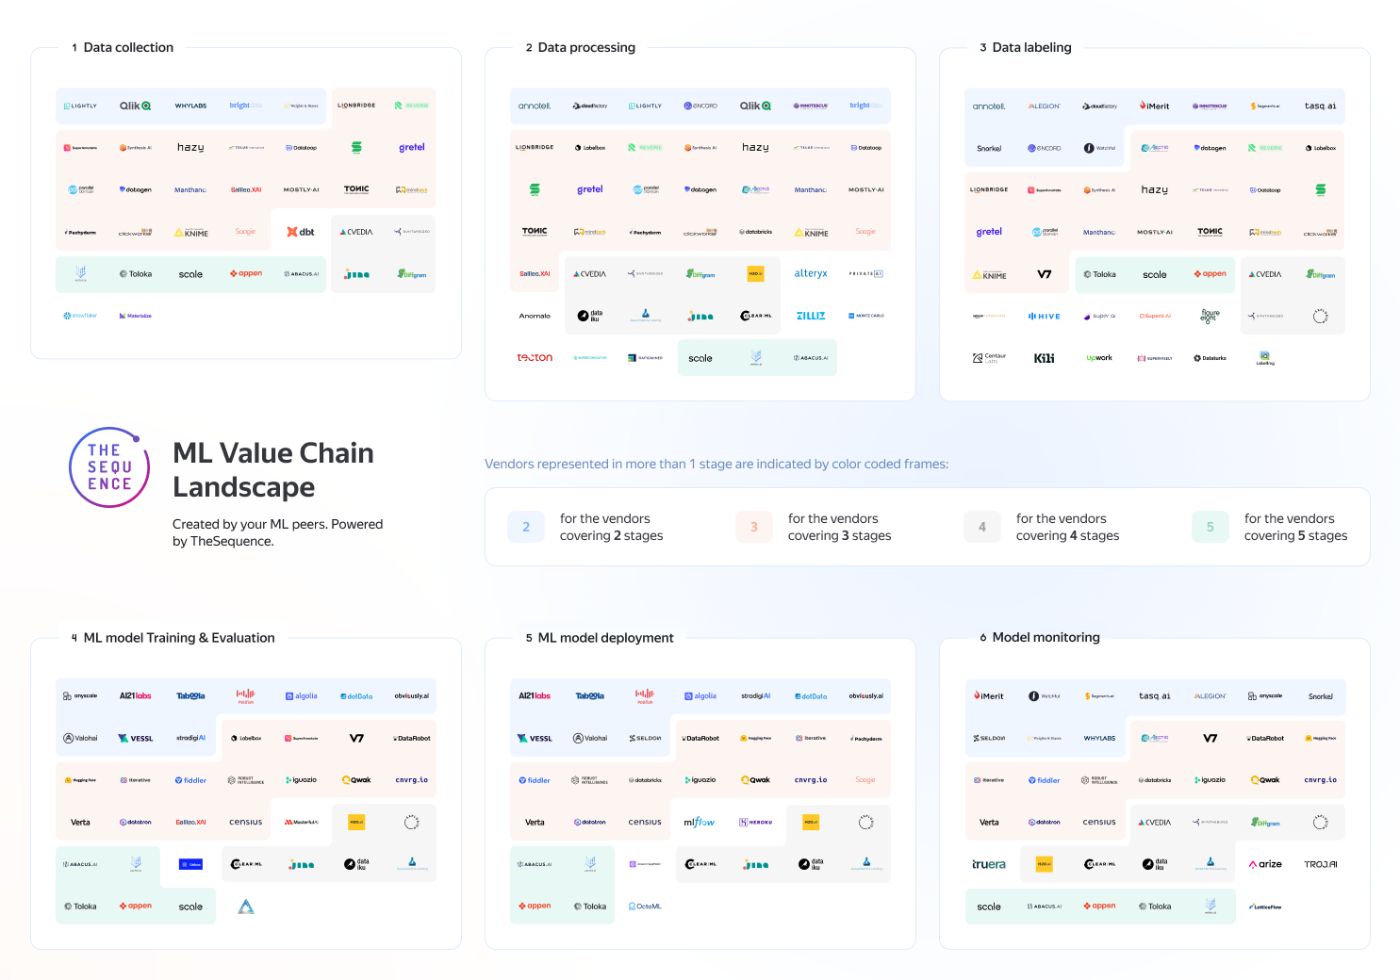 The first ML Value Chain Landscape shaped by ML practitioners
59. A Deep Dive into How Typescript Enums Work
 Enums, short for Enumerations, are preset constants that can be defined by a developer for use elsewhere in the code.
60. Laravel Real-Time Monitoring Using Inspector
 Hi, I'm Valerio, software engineer from Italy.
61. #Debugging Writing Contest: April 2022 Results Announced!
 April's winners of the Debugging Writing Contest, held by HackerNoon and Sentry! Take part to win money from a US$1000 prize pool with 4 winners each month!
62. Manticore Search: Wordforms vs Exceptions
 Exceptions and wordforms are two useful tools built into Manticore Search, which you can use to improve search recall and precision.
63. #Debugging Writing Contest 2022: Round 2 Results Announced
 The wait is over. The Round 2 results for Debugging Writing Contest held with Sentry are here!!
64. Choosing a Computing Method: a Serverless SWOT Analysis
 If you ever find yourself deciding for or against serverless the following tries to make the decision easier for you.
65. Logging Vs. Monitoring: An Introduction [Part 1]
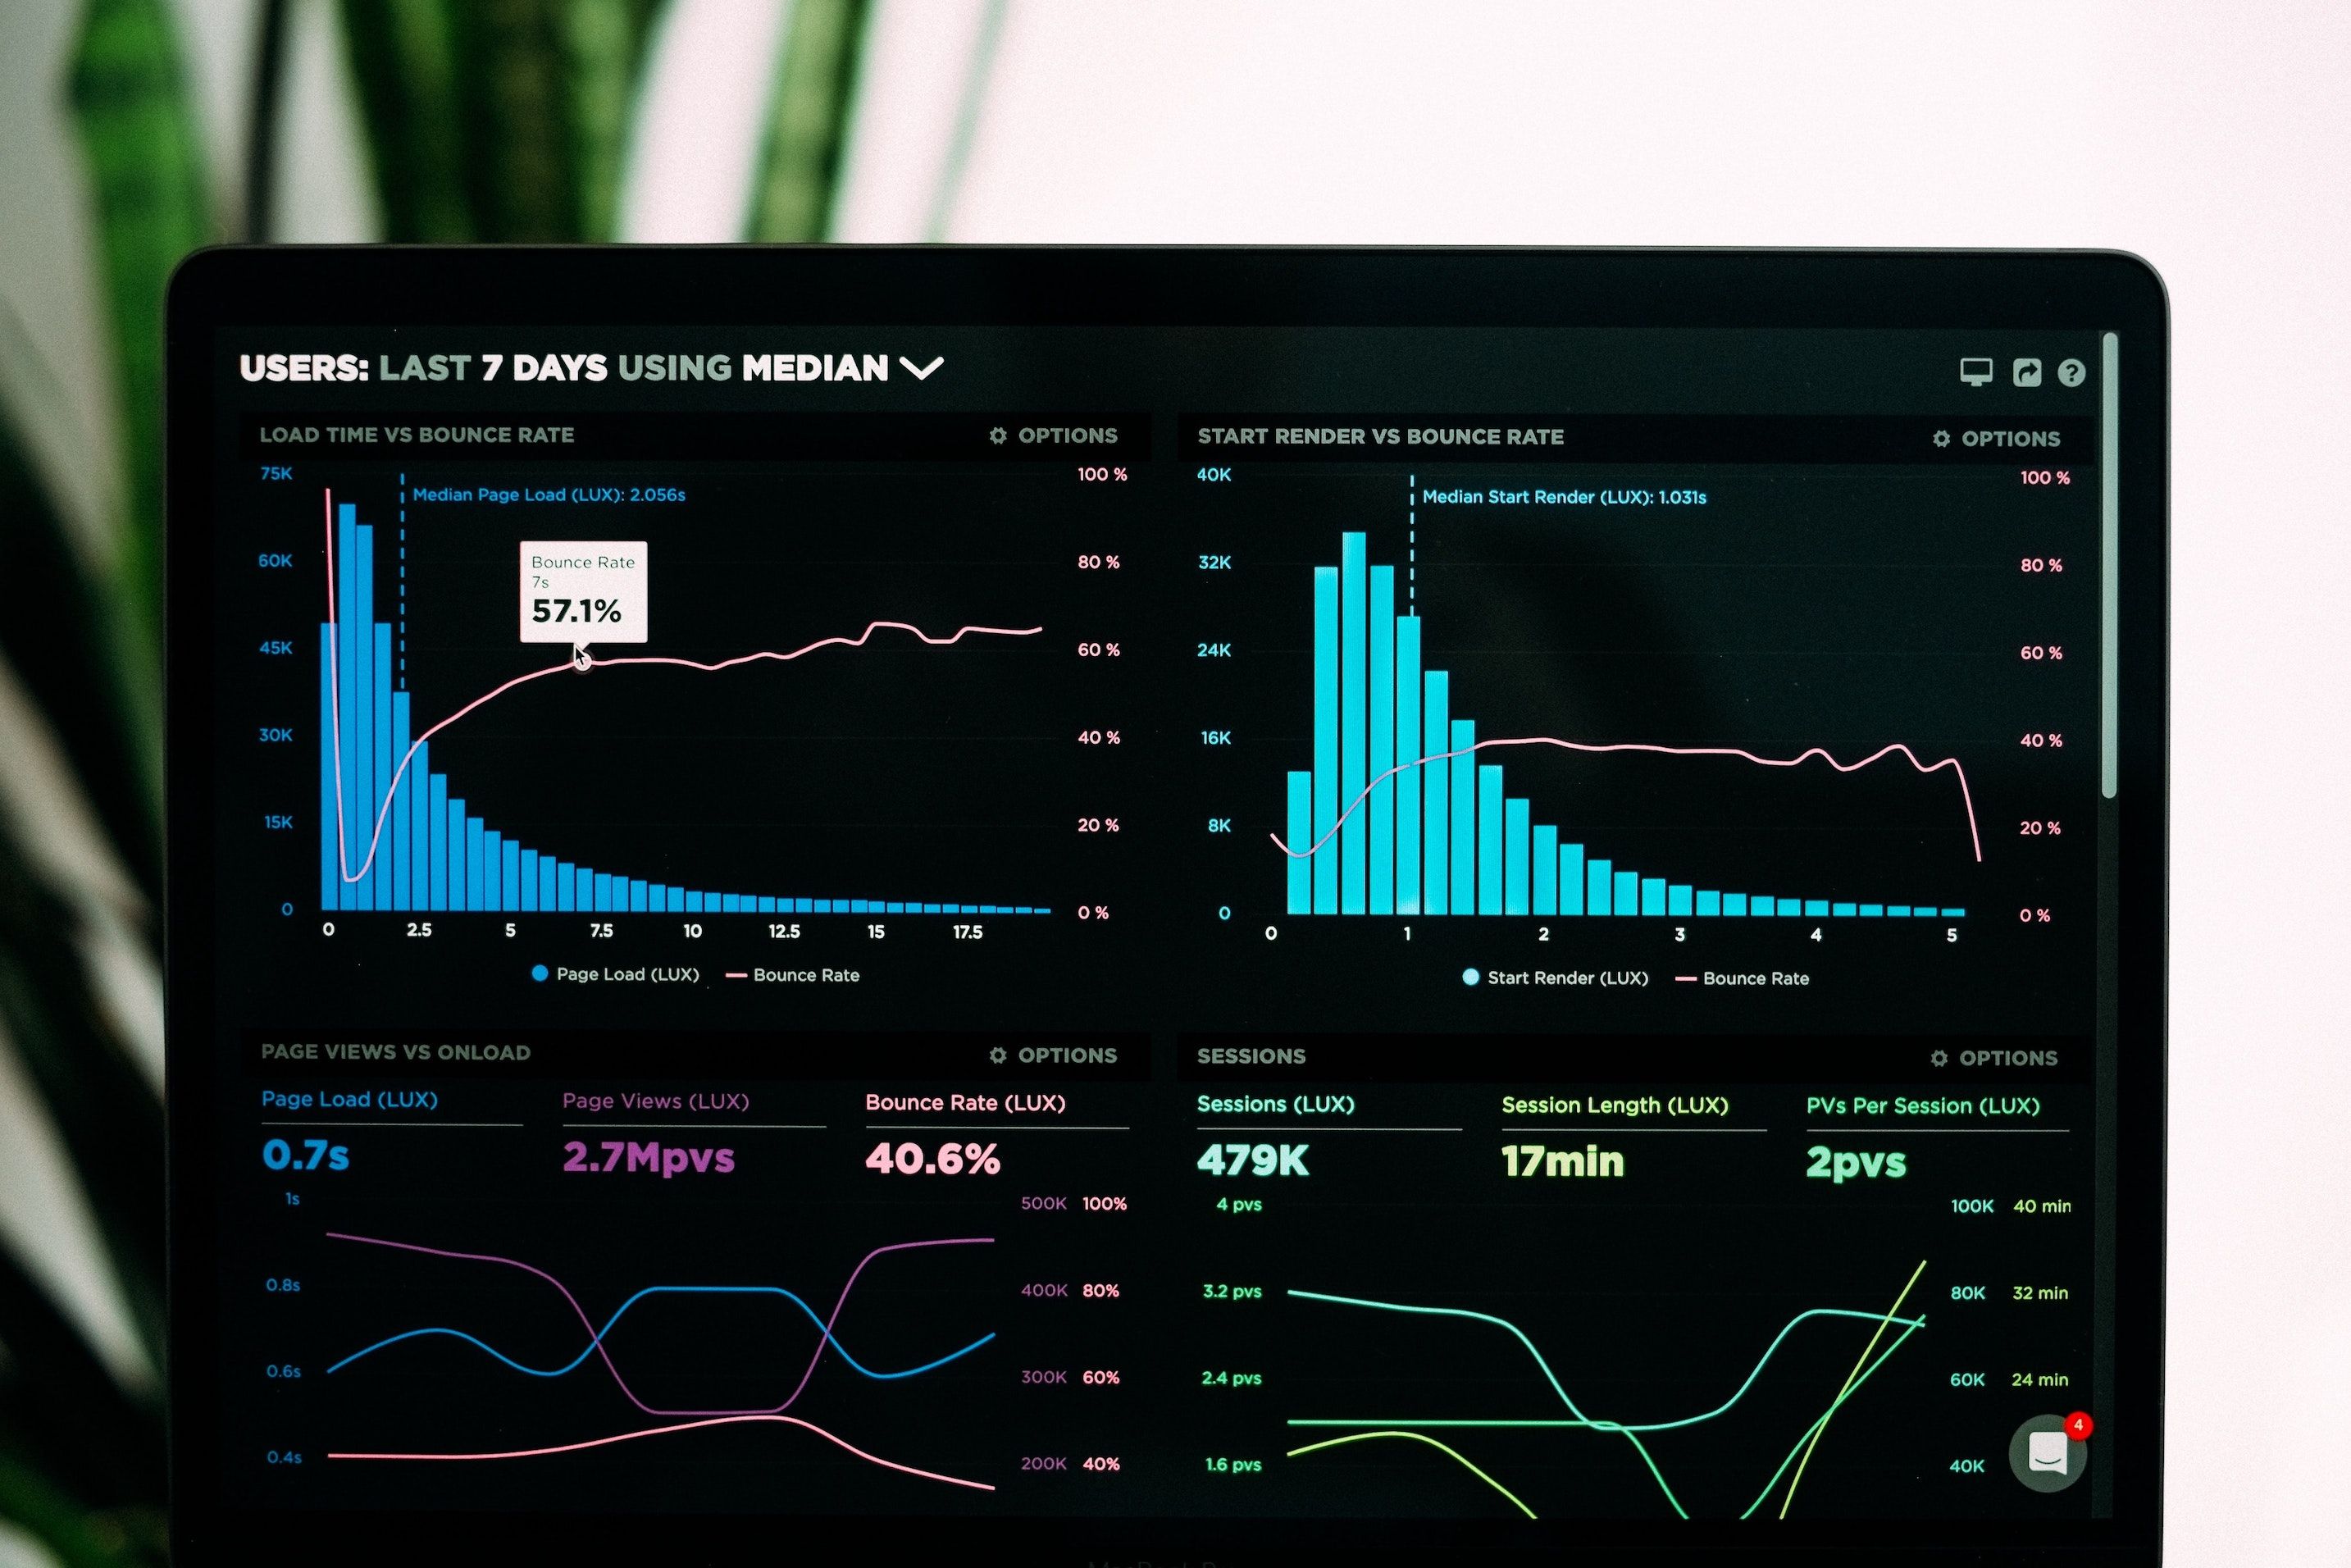 Logging and Monitoring… this I tell you, brother. You can't have one without the other.
66. Purpose-Driven Microservice Design
 Creating purpose-driven microservices should always be a goal. Find out how Render Blueprints can offer a reproducible microservices strategy.
67. Monitor Your Kubernetes Cluster Events With EventRouter, Golang, and Kafka
 In this article, I will show you how to build such a pipeline for processing and storing Kubernetes cluster events.
68. How to Debug JavaScript Right Inside Your Chrome Browser
 Chrome dev tools are a must have tools for modern day developers. Take your first step learning chrome dev tools by learning source debugger.
69. Application Monitoring: Closing Observability Gaps with Custom Metrics
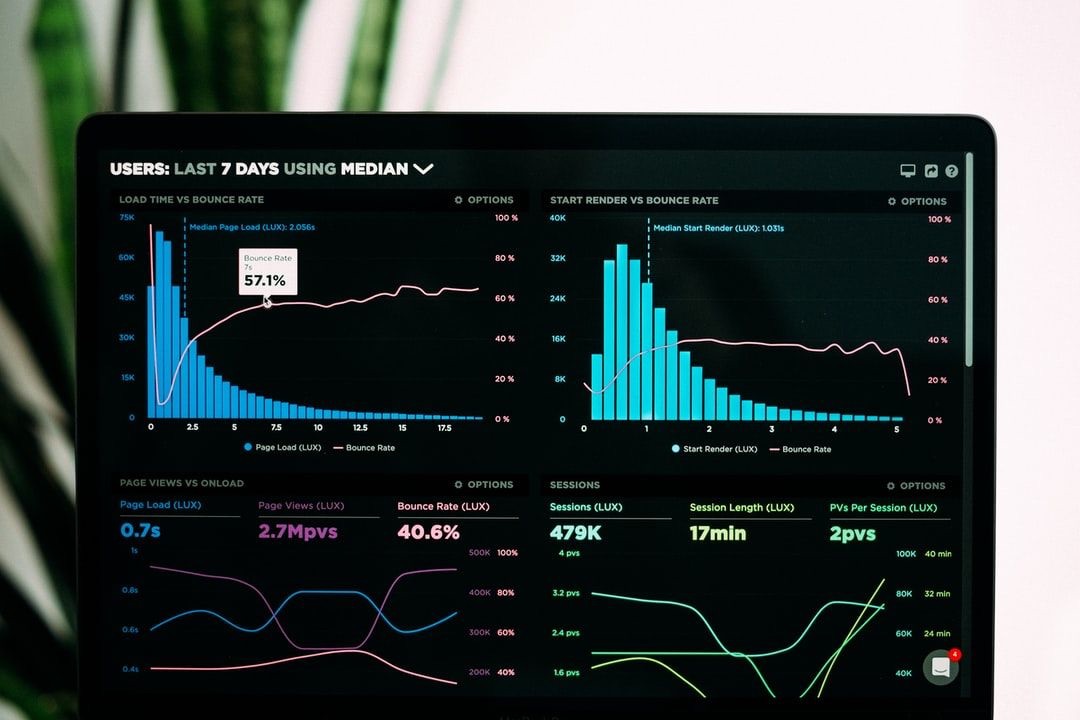 Which application metrics should you collect for your microservices?
70. How To Evaluate Potential IT Monitoring Solutions
 Check out top factors you need to consider when choosing IT monitoring tool. Learn how to pick the best solution for your business.
71. The Debugging Writing Contest 2022: Round 3 Results Announced!
 Round 3, here we go!! Let’s see the June winners of the Debugging Writing Contest by Sentry!
72. A Look into Remote Debugging and Developer Observability
 Connect to remote processes to solve bugs using remote debugging and observability. Learn how you can securely scale your debugging to match growth.
73. Monitoring Your WebRTC Applications’ Performance Can Tremendously Improve Your User Experience
 The last thing a business wants is to be known as an unreliable and poorly performing service, especially if there are similar solutions a few clicks away.
74. What is Observability? Is it Cultural?
 In order to leverage observability we need a significant shift in our corporate culture that encapsulates the entire company & goes beyond the tools.
75. CNCF Tools Overview: Are You Cloud-Native?
 Cloud computing is becoming more and more of a household name, with even the most conservative fields of business figuring out how to make the best use of it. Cloud computing usually starts with running a private cloud solution on premises before venturing onto the public cloud. Of course, the cloud is not a single uniform being. It may come from different providers, Amazon Web Services, Google Cloud Platform, and Microsoft Azure being the biggest players here. Or it may come with different visibility and hosting, that is, public (resides with the provider), private (self-hosted), or hybrid (which uses a bit of both). And the cloud can use different tools and APIs for management as well.
76. The Debugging Writing Contest 2022: Round 4 Results Announced!
 Heyo! Here we are with the Round 4 of the Debugging Writing Contest powered by Sentry and HackerNoon!
77. Scraping Google Shopping Using Puppeteer and Browserless
 An easy tutorial showcasing the power of puppeteer and browserless. Scrape Google Shopping to gather prices of specific items automatically!
78. Error Handling Test for Web Applications Without Coding
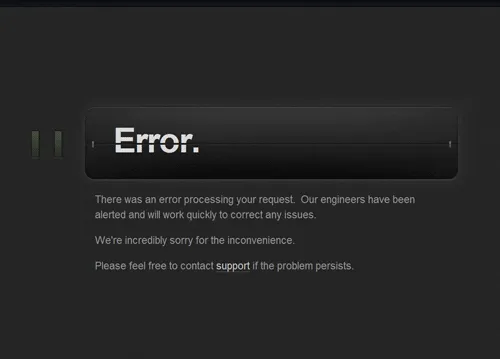 Writing code that works when everything works as expected can be termed as Happy Path coding. It is a very good start. An experienced developer actually thinks all possible use cases and corner cases and make sure his code informs the users of the application even when an unexpected error happens. This level of coding is brilliant and the most wanted way to operate in Software Engineering.
79. Spring Boot Performance Workshop with Vlad Mihalcea
 Learn how to improve the performance of a Spring application and diagnose problems in production. Lessons from our live workshop covering JPA!
80. How to Understand Source Code and Delve Deep into the Codebase
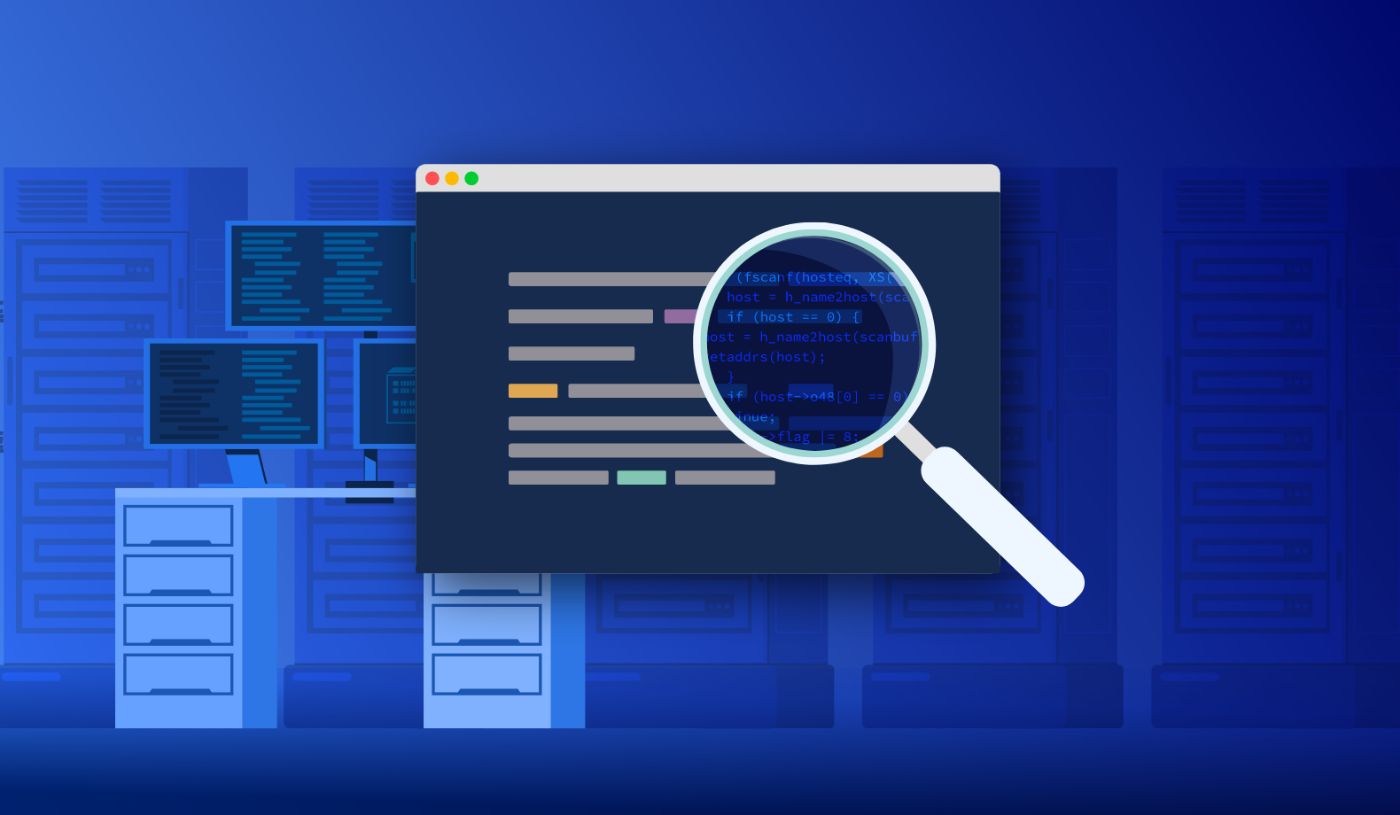 Learn a new codebase by diving into it with debuggers to understand the full extent of internal semantics & interactions within the project.
81. Grafana Loki: Architecture Summary and Running in Kubernetes
 Grafana Loki logging system architecture and components, its setup in Kubernetes from the Helm chart with AWS S3 as Single Store and boltdb-shipper for indexes.
82. Vue Amsterdam 2022 - Part VI: It’s a (Testing) Trap!
 Common testing pitfalls and how to solve them.
83. The Ballooning Costs of Metrics: Why Your Monitoring Data and Bill Get Out Of Hand
 Why does our metric data volume and our bill get out of control? How is it related to cardinality? And how can DevOps and SRE proactively manage it?
84. The #Debugging Writing Contest
 Hey Hackers! Sentry & HackerNoon are super excited to host a Debugging Writing Contest! Here’s your chance to win money from a $1000 monthly prize pool.
85. Microservice Observability Patterns [Part 2]
 In my previous article, I talked about the importance of logs and the differences between structured and unstructured logging. Logs are easy to integrate into your application and provide the ability to represent any type of data in the form of strings.
86. Logging Vs. Monitoring: Best Practices for Logging [Part 2]
 Logging and Monitoring… this I tell you, brother. You can't have one without the other.
87. Use Database Transaction Logs to Implement Observer Pattern
 The best way to implement the observer pattern - using transaction logs of databases.
88. Setup Monitoring Using Apache Zookeeper and OpenTelemetry
 In this article, I’ll show you a simplified way to configure a critical open-source component, Zookeeper.
89. Debugging Collections, Streams and Watch Renderers
 Inspecting the data in the watch quickly is key to a fast and effective debugging session. Here's how you can see the data that's important instantly!
90. Contest Prompt Questions: Debugging [Sample 2]
 Bugs, like code, can be baffling and intricate. Why is there a random part of the screen glitching for no apparent reason? Is it the Matrix, your code, both?
91. How to Monitor a Bagisto e-commerce in Real-Time using Inspector
 Hi I'm Valerio, software engineer from Italy and CTO at Inspector.
92. The Browser in the Browser (BITB) Attack: Lies, Deceit, and CSS
 “Beware the Ides of March”, they say; and we should for good reason.
93. Monitor Nginx Metrics with GrafanaDR: A Step-by-Step Guide
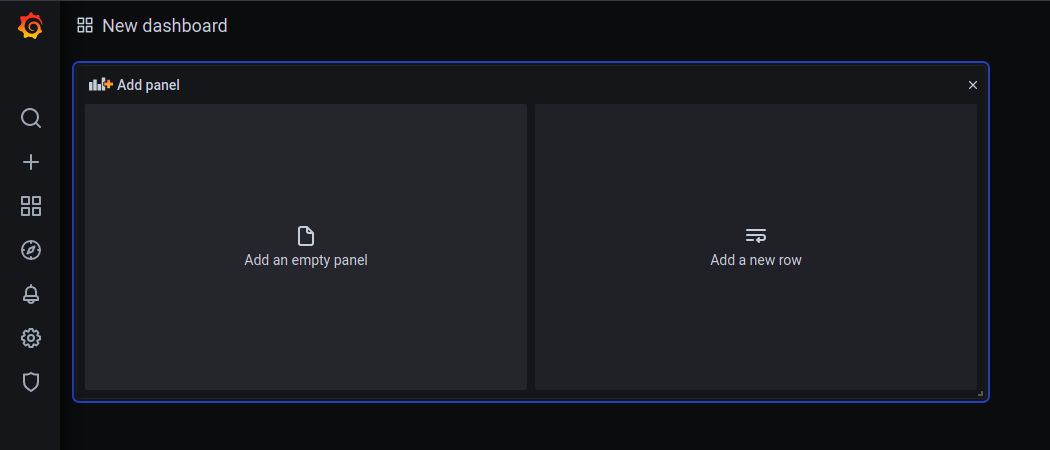 Monitor Key Nginx Metrics with Grafana
94. Node.js Monitoring Made Easy

95. Laravel Background Processes Analytics with Inspector
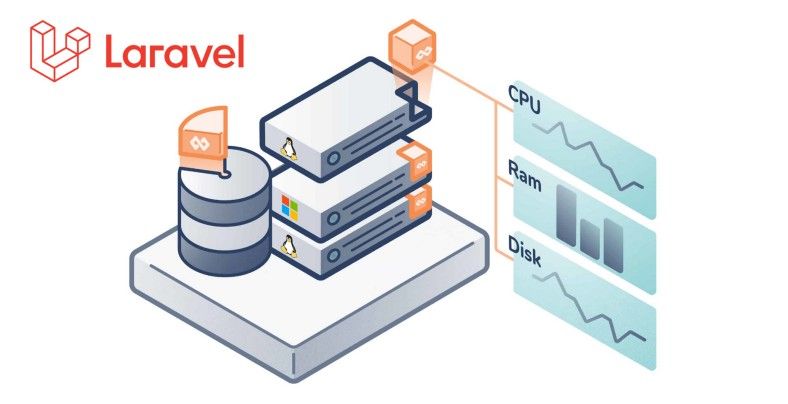 In this article I would show you how to turn on analytics in the dark side of your application: "background Jobs and scheduled Artisan commands execution".
96. How to Monitor Serverless Applications With AWS CloudWatch Alarms
 Running any application in production assumes reliable monitoring to be in place and serverless applications are no exception.
97. Dirty Jobs: Debugging Till the Last Minute
 Debugging in practice means getting lost on tangents, trying to look good in front of your subordinates and doing just a little bit of debugging on the side.
98. The Debugging Writing Contest 2022: Round 5 Results Announced!
 Here are the nominees and winners for the 5th Round (August 2022) of Debugging Writing Contest by Sentry and HackerNoon.
99. An Intro to QAOps in Continuous Delivery Systems
 In the common paradigm, dedicated QA teams solely focus on product quality. QAOps enables an efficient quality assurance process.
100. The $5 Billion DevOps Stranglehold
 Ten years ago NewRelic, DataDog, Splunk, Dynatrace and SolarWinds built tools we loved to use. They were easy to implement and solved problems quickly and efficiently. Each company was known primarily for a single, well-conceived product. NewRelic’s APM. Splunk’s log file analyzer. DataDog’s server monitor. SolarWinds’ network performance monitor. These companies were beloved by users during the 2000s.
101. Top 25 Employee Monitoring and Time Tracking Apps for Windows/MAC
 Many companies today install various tracking apps on their employees’ computers and check if their team members are productive during the working day. Such an extreme approach to monitoring what the staff is doing is due to the lack of employees’ efficiency at the workplace and to the employer’s desire to prevent data leakage and other unwanted actions. Before we go through the list of the most popular and effective programs to monitor employees’ activities at the workplace, let’s take a look at the most efficient ways to find out if your company is monitoring you.
102. How to build a Slack App more reliable then Slack
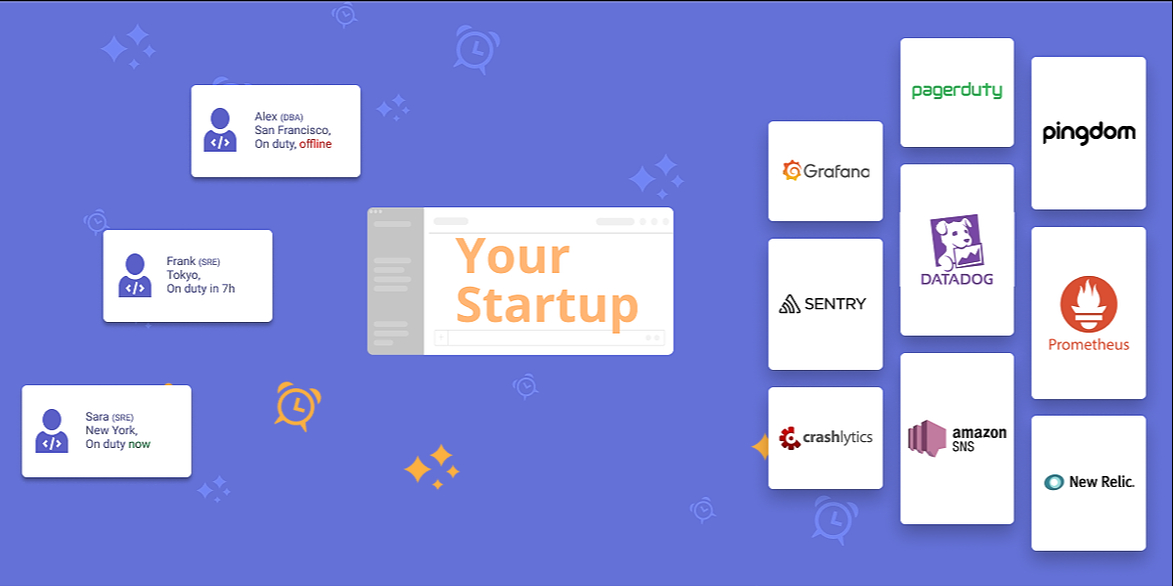 When I started working on a start-up nine months ago, this statement didn’t satisfy me or my co-founders:
103. How to Fix iOS 16 Bugs
 How to Fix iOS 16 Problems, Bugs and Issues - A Simple Guide.
104. The Definitive Crash Course on Serverless with AWS: Centralized logging with Kinesis and Lambda
 Don’t you just hate it when APIs are failing and you have absolutely no clue why? Now imagine you don’t have access to the VM, cluster or container where your software is running. Want me to continue with this nightmare?
105. Exploring Differences Between Monitoring And Observability
 Monitoring vs Observability: in this article, we're explaining what is observability exactly and how does it differ from monitoring.
106. Comparing Different Serverless Monitoring Platforms
 Technology touches almost every corner of the world economy. Even when it’s an indirect relation, in many cases tech is an essential, vital part of our societies. It just can’t fail without causing too much distress and losses. Not only financially, but especially to the human aspect.
107. Kubernetes Monitoring with Prometheus and Thanos
 Introduction
108. Best Practices to Write Unit Tests the Right Way
 In this article we will review some best practices and must-have libraries which will get your unit tests to the next level.
109. N/A
 please delete this
110. Using Rust For Monitoring 30k API Calls Per Minute
 At Bearer, we are a polyglot engineering team. Both in spoken languages and programming languages. Our stack is made up of services written in Node.js, Ruby, Elixir, and a handful of others in addition to all the languages our agent library supports. Like most teams, we balance using the right tool for the job with using the right tool for the time.
111. Ultimate Guide to Synthetic Monitoring Products
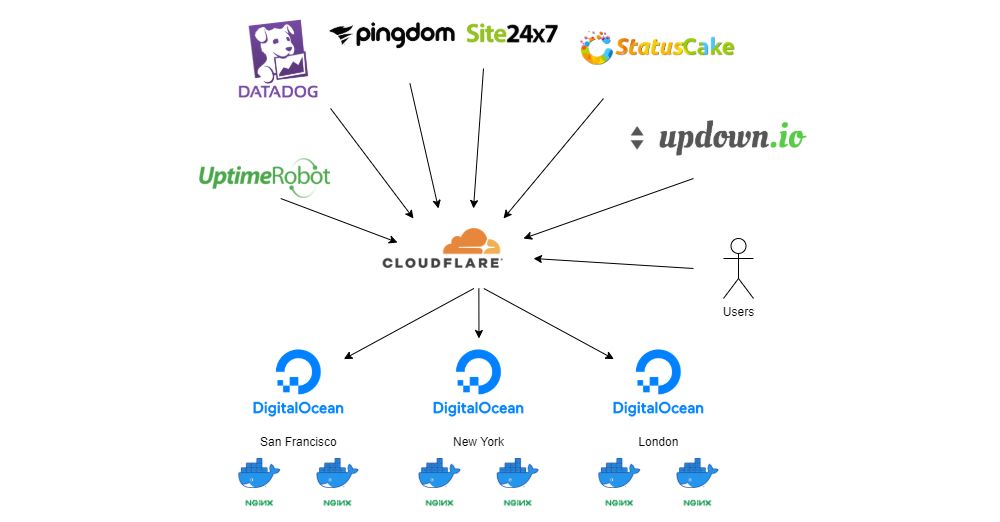 As we look forward to 2021, Synthetic Monitoring continues to be as important as ever in understanding the performance of your app or website. But your synthetic monitoring is only as good as the tool you're using and there are a lot of product choices. Since selecting the best one for you is critical, the choice can be overwhelming. Price, setup ease, accuracy, and more play a part in the best solution.
112. Production Troubleshooting - What to do When Disaster Strikes
 Production is failing and everything is lost? That used to be the case. Fail whale, hysteria and panic. Developer observability fixes this!
113. The Best Solution Ever For Application Monitoring
 Just because we do something one way, doesn’t always mean it is the right way … or even the best way.
114. How to Use OpenTelemetry to Identify Database Dependencies
 Tired of debugging your application to find out its database dependencies? There is a smarter way to track them with OpenTelemetry.
115. Introducing a better way to record custom metrics
 Many clients have asked me “how do I record custom metrics from Lambda?”.
116. Introduction to AWS Log Insights as CloudWatch Metrics
 A step-by-step description of how to create an AWS Lambda to convert Cloudwatch LogInsights into metrics
117. 5 Apps to Monitor Your Kids Online Activity Without Them Knowing
 Dealing with real-life problems has always been challenging, but now, you must know how to deal with digital negative consequences, or your kids can interact with digital dangers. Parents often do not take the internet dangers seriously, and their children have to face such issues later. You can also make many things possible using technology, but if you know how to make everything possible.
118. Strategies For Mobile App Performance Testing
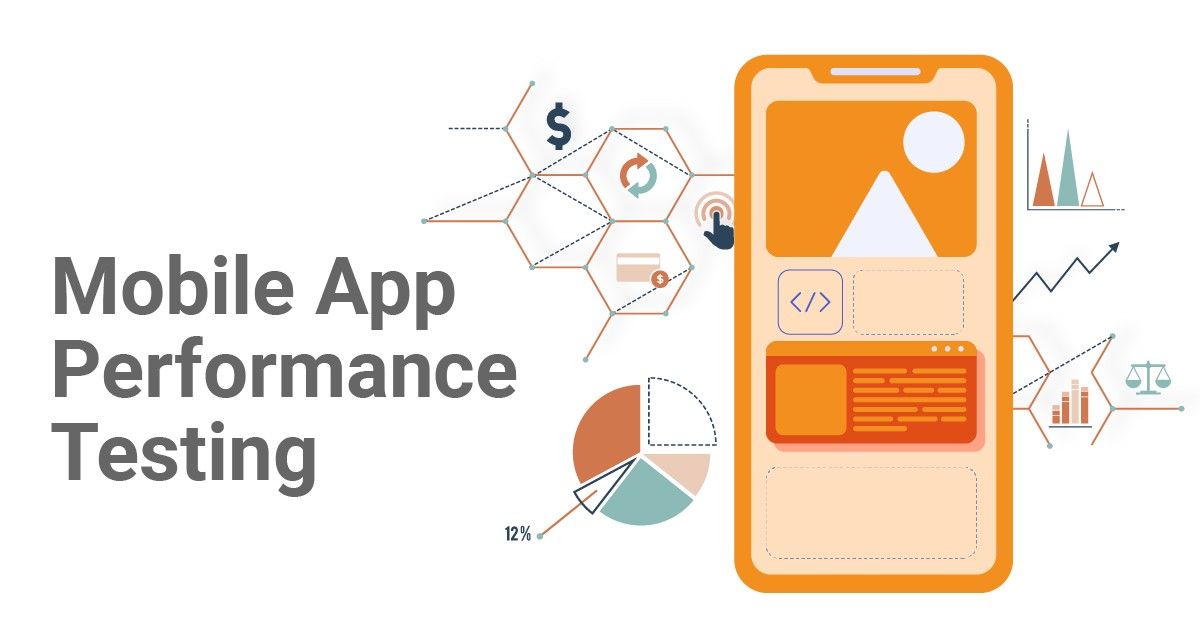 A good app is one that can perform better and these performances are tested through some performance matrices which are highlighted here.
119. A Quick Start Guide to Use ShardingSphere-Proxy in Real Production Scenarios
 This post describes how to use ShardingSphere-Proxy and what's its differences with ShardingSphere-JDBC.
120. Introduction to Observability in ITOM and AIOps
 Observability is a best practice implemented by AIOps, enabling automation and expanding visibility into the entire organizational ecosystem.
121. Internal AWS Monitoring is Hard to Grasp
 Learm how a serverless monitoring solution can catch problems for you without the painful learning curve connected to serverless failure detection.
122. 4 Reports to Track in Your Microsoft Hyper-V Environment
 If you use Microsoft Hyper-V every day, you may want to spend some time producing and analyzing reports. Monitoring and reporting can help optimize VMs.
123. What is Production Blindness?
 Cloud rose to fame on the banner of cutting costs but with its tremendous growth the spend is rocketing. Learn how you can cut down overspend.
124. JMXTerm-An Open-Source Debugging Tool
 Monitor your application in production or locally. Understand what's going on under the hood while debugging & change application settings on the fly.
125. Software Testing as a Job to Enter the Tech Space
 Software testing is a tech job that doesn’t get as much attention as it deserves.
126. How To Save Your Child From Teen Sexting

127. Clickhouse vs Elasticsearch vs Manticore Search Query Times With a 1.7B NYC Taxi Rides Benchmark
 New York City (NYC) taxi rides are probably the most commonly used benchmark in the area of data analytics.
128. What is RS232 Communication?
 As many of you are no doubt aware, it’s not easy to find a modern consumer-grade computer today that would have a classic serial port. However, just because laptop makers stopped adding them doesn’t mean the legacy ports are no longer used nowadays. Being an essential part of medical and networking equipment, serial ports can still be found on a large number of old and new useful devices.
129. So, How are Observability and Monitoring Different, Actually?
 The similarities and differences between monitoring and observability and how to pair the two strategies
130. How to Save Hundreds of Hours on Lambda Debugging
 Lambda debugging can take hours to resolve. Learn these time-saving methods to quickly scan logs and errors in your Lambda functions
131. NodeJS: Code Execution Monitoring With Inspector
 Have you ever desired to watch your code running, instead of just imagining it?
132. How Quake III Helped Me Debug Strawberry Filled Kiełbasa
 The famous story about Quake, kiełbasa, pierogi, debugging and the birth of a new career in a small city in the middle of Poland that you were looking for
133. 7 Chrome Plugins You Must Install Today
 Before you start reading this article, hit ALT+CONTROL+DELETE, then click on your task manager, and make a note of the CPU and Memory usage of Google Chrome.
134. Guiding Observers Through Prometheus' Architecture
 We heard of Prometheus being an open-source solution for system monitoring, thanks to SoundCloud. But what are its other use cases? How is it being leveraged?
135. NEW Gaming and Debugging Contests Announced With Awesome Cash Prizes
 Check out these two NEW writing contests ON NOW!
136. Build, Monitor and Troubleshoot Your Smart Contracts on RSK with Tenderly
 Smart Contracts Monitoring Platform Tenderly has added support for RSK. Developers working with RSK can now make use of Tenderly’s seamless tools.
137. PHP on Docker from Scratch in 2022
 How to set up a repository with Docker 'from scratch' to develop PHP 8.1 applications in 2022.
138. What is the ideal memory size to lower costs of running a task on Lambda?
 Should you increase Lambda memory? It might sound crazy, but increasing your AWS Lambda memory could actually lower your bills. Find out how.
139. Getting Started With Rego
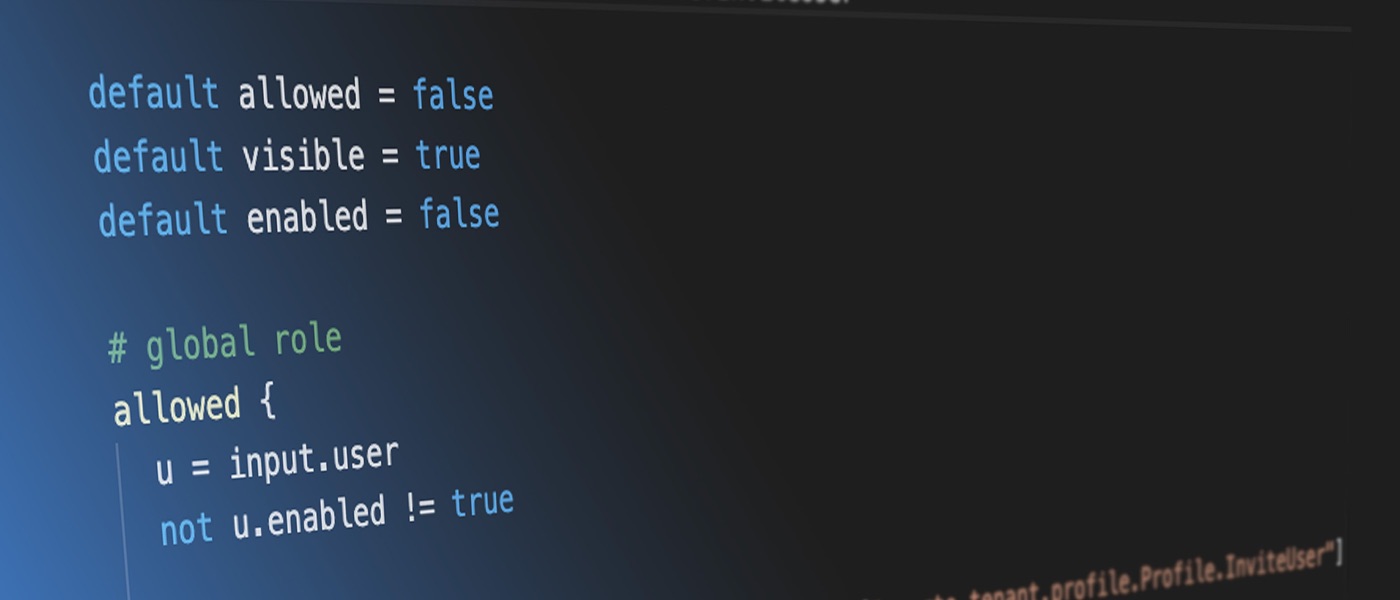 For engineers that are used to imperative languages like Javascript or Python, Rego can look a bit foreign. Here's a few tips for getting started.
140. How to Perform Data Augmentation in NLP Projects
 In machine learning, it is crucial to have a large amount of data in order to achieve strong model performance. Using a method known as data augmentation, you can create more data for your machine learning project. Data augmentation is a collection of techniques that manage the process of automatically generating high-quality data on top of existing data.
141. DevOps Vs. SRE: Similarities, Differences, and Challenges
 With the global tech giants like Google, Amazon, and Netflix pioneering the adoption of DevOps and SRE, their ROI has grown in leaps and bounds.
142. How To Use Google Search Privacy Settings
 we will discuss a few methods to get rid of (to disable) the “Google’s Search activity, Search settings, disable Your data on Search”.
143. 3 Golang Pitfalls Every Developer Needs to Know
 Over-viewing common coding pitfalls we've encountered when we started to use GoLang for production systems
144. SPA Tracking & Monitoring: How to Build Better Single-Page Applications With Real User Monitoring
 Did you know roughly half of the users that visit your website leave if it takes more than 3 seconds to load? Optimizing your website or webapp for stellar performance is always a crucial goal for any software-based business.
145. Free Monitoring of Processes and Servers in 3 Easy Steps
 Heartbeat.sh provides one of the simplest ways to monitor your servers and processes for free. If I want to monitor a service, I can monitor it by simply sending an HTTP POST request to my heartbeat.sh server, and voila, my service is being monitored! I will show you how to do this in three easy steps.
146. Maintaining Quality When Transitioning from Monolith to Microservices
 Piece by piece, legacy monolith applications are being broken down and replaced by microservices.
147. Shrinking Choices, Shrinking Values - Property-based Testing (Part 5)
 Explaining how property-based testing libraries like hypothesis shrink random values to make them easier to understand and debug.
148. How To Speed Up Your Website and Reduce Loading Times
 Website speed testing is important. There’s no one-size-fits-all solution when it comes to website speed, but here are some common issues people face.
149. Change Data Capture to Accelerate Real-time Analytics
 There is nothing new in saying that startups leverage Big Data and AI to develop more innovative business models.
150. How Goji Investments Enhances Developer Experience via Observability
 This post was written by Dean Record, Engineer at Goji Investments.
151. How to Use Rungutan to Create Load Testing Alerts
 How to set up automated alerts and always be aware of your platform's performance.
152. 5 Tips to Effectively Monitor Heroku Applications
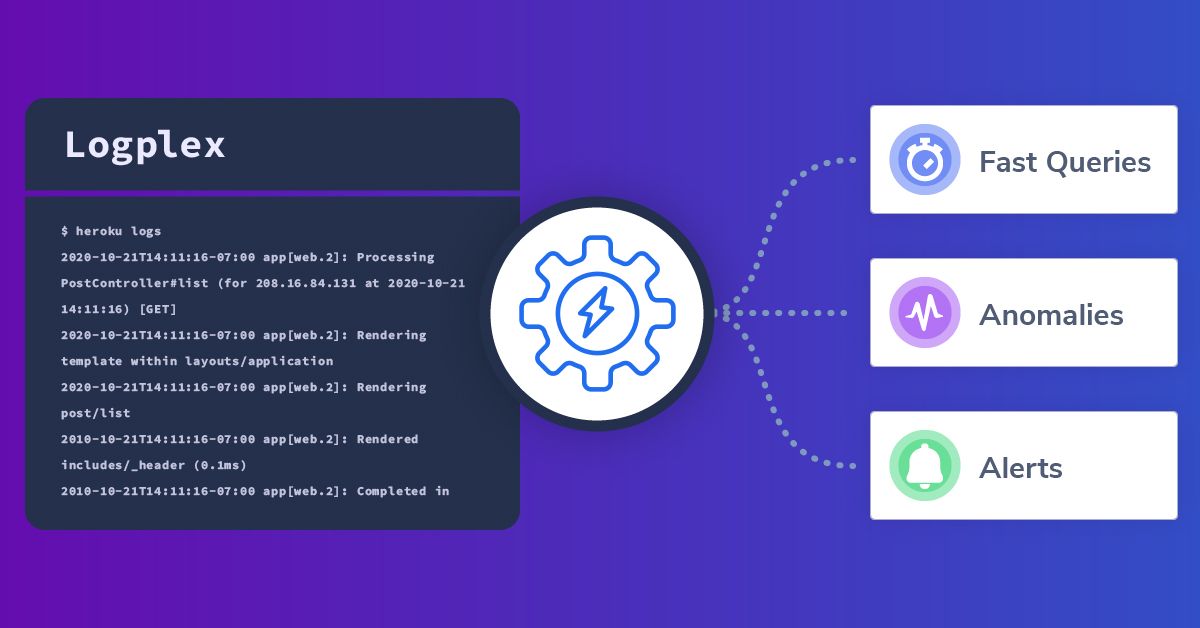 Heroku differentiates itself from other cloud providers, by offering a complete, cohesive environment. Where AWS and GCP present a decoupled toolkit, Heroku strives for a seamless, UI-driven experience for the user. This philosophy is clearly embodied in its metrics functionality, which is often a single click or basic configuration file away.
153. Debugging Node JS Inside Docker: An Essential Guide
 Ever wondered how to debug inside a Docker Container? Learn how to use remote debugging to debug remotely in a docker container.
154. Instrumention and Monitoring API in Node.js
 The concept of instrumentation often refers to tracing where events happen in an application. Many application performance monitoring (APM) tools use it to provide metrics on the inner workings of your application. But sometimes, all you really need are details about API calls.
155. Database Monitoring and Alerting with n8n 📡
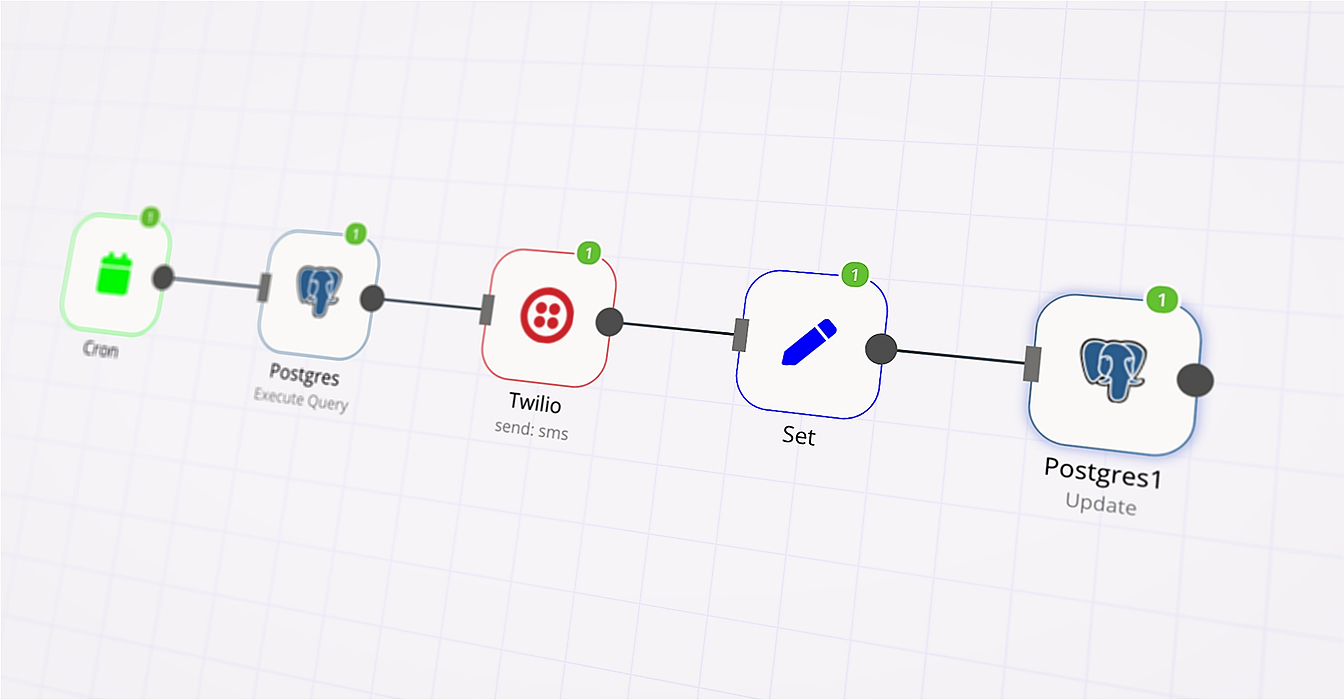 In the past few months, I have been playing around with different kinds of IoT devices and sensors. I quite enjoy how these can be used to monitor different things like humidity, temperature, pressure among other things in the house. In this tutorial, I want to show you how you can monitor sensor readings in a database and send alerts when it crosses a threshold value using n8n workflows.
156. Introduction to Delight: Spark UI and Spark History Server
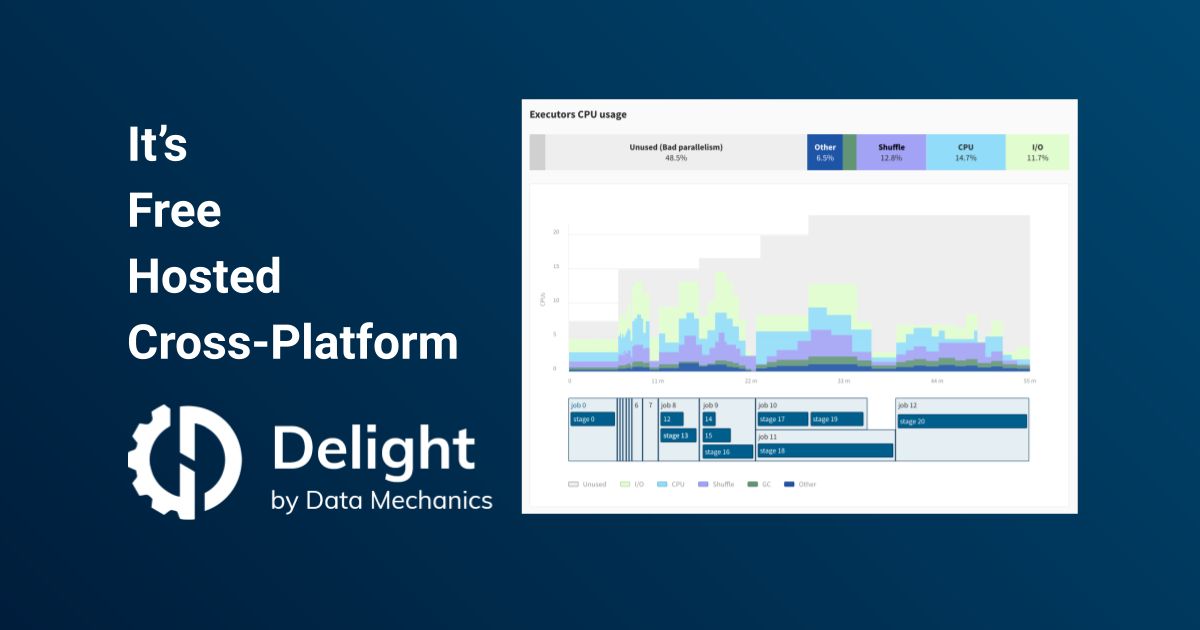 Delight is an open-source an cross-platform monitoring dashboard for Apache Spark with memory & CPU metrics complementing the Spark UI and Spark History Server.
157. How to Set up a Heroku Postgres Database with Librato
 In this article, you will learn how to set up a Heroku Postgres database with Librato for automated monitoring.
158. Speed and Quality are Not Mutually Exclusive: Telemetry is the Key
 All engineering teams strive to build the best product they can as quickly as possible. Some, though, stumble into a false dichotomy of choosing between speed and quality. While that choice may have been necessary in the past, it’s not the case today.
159. Learn How to Live with Immutable and Reliable Objects in Java
 Create immutable object java. The best way to create Immutable object. Reliable Objects Java
160. Incident Management Best Practices: 2021 Edition
 Covering the basics
161. Assets Monitor as a Function
 In this article, I’ll show you how to create Assets Monitor with Python3.7 + Serverless lambda
162. Modern Day Challenges to Monitoring Microservices
 Monitoring microservices and cloud-native systems is challenging. In this article: which open source is best suited in Kubernetes environments?
163. Setting Up AWS CloudWatch Alerts (vs Dashbird Alerts) To Monitor Your Applications
 Learn about the best practices for AWS Cloudwatch Alerts and Dashbird Alarms, to not miss out on critical info about your serverless app.
164. The Debugging Writing Contest 2022: Final Round Results Announcement
 YAAAASSSSS, it’s the Finale! Welcome to the final round results of the Debugging Writing Contest by Sentry!
165. Technical Huddle: An Easy Way To Turn Challenges Into Success
 The Challenge
166. Optimizing Database Operations With OpenTelemetry
 Learn to use OpenTelemetry to monitor and identify the database issues in your application and remediate them to optimise your database operations quickly.
167. Improving the Code One Line at a Time
 In previous episodes, we showed some heuristics to find not-so-good code.
168. 7 Easy Steps to Set Up Google Analytics on Your Next.JS Website
 A guide to help you set up Google Analytics 4 on your Next.js website.
169. How To Find Your Docker Logs
 There’s a short answer, and a long answer. The short answer, that will satisfy your needs in the vast majority of cases, is:
170. Building a Design System for Email Templates (React)
 Arthur Tkachenko is releasing a React component-based design system for email templates.
171. The Importance of Monitoring Big Data Analytics Pipelines
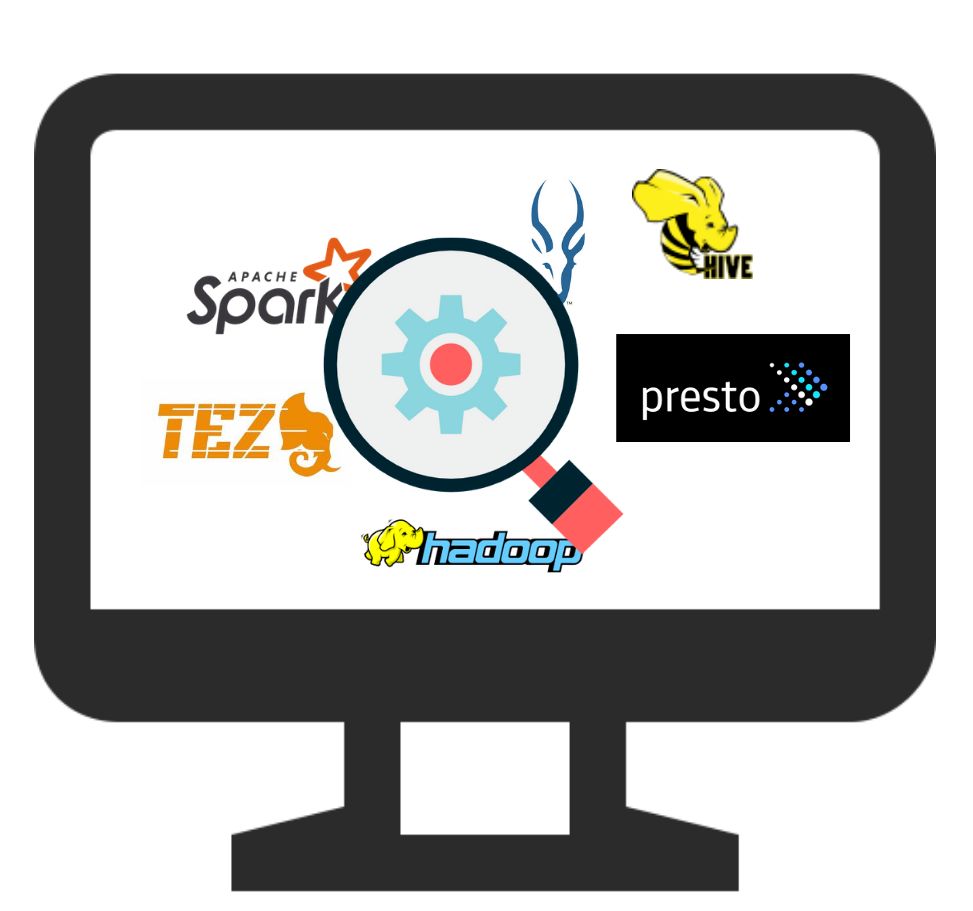 In this article, we first explain the requirements for monitoring your big data analytics pipeline and then we go into the key aspects that you need to consider to build a system that provides holistic observability.
Thank you for checking out the 171 most read stories about Monitoring on HackerNoon.
Visit the /Learn Repo to find the most read stories about any technology.

